

Note
Go to the endto download the full example code.
Multicursor#
Showing a cursor on multiple plots simultaneously.
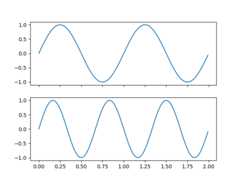
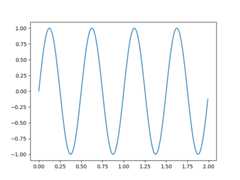
This example generates three Axes split over two different figures. Onhovering the cursor over data in one subplot, the values of that datapoint areshown in all Axes.
importmatplotlib.pyplotaspltimportnumpyasnpfrommatplotlib.widgetsimportMultiCursort=np.arange(0.0,2.0,0.01)s1=np.sin(2*np.pi*t)s2=np.sin(3*np.pi*t)s3=np.sin(4*np.pi*t)fig,(ax1,ax2)=plt.subplots(2,sharex=True)ax1.plot(t,s1)ax2.plot(t,s2)fig,ax3=plt.subplots()ax3.plot(t,s3)multi=MultiCursor(None,(ax1,ax2,ax3),color='r',lw=1)plt.show()
References
The use of the following functions, methods, classes and modules is shownin this example:
Total running time of the script: (0 minutes 1.018 seconds)