

Note
Go to the endto download the full example code.
Color Demo#
Matplotlib recognizes the following formats to specify a color:
an RGB or RGBA tuple of float values in
[0,1](e.g.(0.1,0.2,0.5)or(0.1,0.2,0.5,0.3)). RGBA is short for Red, Green, Blue, Alpha;a hex RGB or RGBA string (e.g.,
'#0F0F0F'or'#0F0F0F0F');a shorthand hex RGB or RGBA string, equivalent to the hex RGB or RGBAstring obtained by duplicating each character, (e.g.,
'#abc', equivalentto'#aabbcc', or'#abcd', equivalent to'#aabbccdd');a string representation of a float value in
[0,1]inclusive for graylevel (e.g.,'0.5');a single letter string, i.e. one of
{'b','g','r','c','m','y','k','w'}, which are short-hand notationsfor shades of blue, green, red, cyan, magenta, yellow, black, and white;a X11/CSS4 ("html") color name, e.g.
"blue";a name from thexkcd color survey,prefixed with
'xkcd:'(e.g.,'xkcd:skyblue');a "Cn" color spec, i.e.
'C'followed by a number, which is an index intothe default property cycle (rcParams["axes.prop_cycle"](default:cycler('color',[(0.12156862745098039,0.4666666666666667,0.7058823529411765),(1.0,0.4980392156862745,0.054901960784313725),(0.17254901960784313,0.6274509803921569,0.17254901960784313),(0.8392156862745098,0.15294117647058825,0.1568627450980392),(0.5803921568627451,0.403921568627451,0.7411764705882353),(0.5490196078431373,0.33725490196078434,0.29411764705882354),(0.8901960784313725,0.4666666666666667,0.7607843137254902),(0.4980392156862745,0.4980392156862745,0.4980392156862745),(0.7372549019607844,0.7411764705882353,0.13333333333333333),(0.09019607843137255,0.7450980392156863,0.8117647058823529)]))); the indexing is intendedto occur at rendering time, and defaults to black if the cycle does notinclude color.one of
{'tab:blue','tab:orange','tab:green','tab:red','tab:purple','tab:brown','tab:pink','tab:gray','tab:olive','tab:cyan'}which arethe Tableau Colors from the 'tab10' categorical palette (which is thedefault color cycle);
For more information on colors in matplotlib see
theSpecifying colors tutorial;
the
matplotlib.colorsAPI;theList of named colors example.
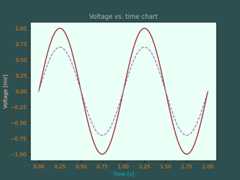
importmatplotlib.pyplotaspltimportnumpyasnpt=np.linspace(0.0,2.0,201)s=np.sin(2*np.pi*t)# 1) RGB tuple:fig,ax=plt.subplots(facecolor=(.18,.31,.31))# 2) hex string:ax.set_facecolor('#eafff5')# 3) gray level string:ax.set_title('Voltage vs. time chart',color='0.7')# 4) single letter color stringax.set_xlabel('Time [s]',color='c')# 5) a named color:ax.set_ylabel('Voltage [mV]',color='peachpuff')# 6) a named xkcd color:ax.plot(t,s,'xkcd:crimson')# 7) Cn notation:ax.plot(t,.7*s,color='C4',linestyle='--')# 8) tab notation:ax.tick_params(labelcolor='tab:orange')plt.show()
References
The use of the following functions, methods, classes and modules is shownin this example:
Tags:styling: colorplot-type: linelevel: beginner