

Note
Go to the endto download the full example code.
SI prefixed offsets and natural order of magnitudes#
matplotlib.ticker.EngFormatter is capable of computing a naturaloffset for your axis data, and presenting it with a standard SI prefixautomatically calculated.
Below is an examples of such a plot:
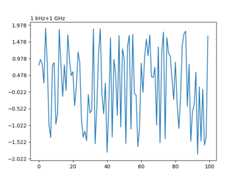
importmatplotlib.pyplotaspltimportnumpyasnpimportmatplotlib.tickerasmticker# Fixing random state for reproducibilitynp.random.seed(19680801)UNIT="Hz"fig,ax=plt.subplots()ax.yaxis.set_major_formatter(mticker.EngFormatter(useOffset=True,unit=UNIT))size=100measurement=np.full(size,1e9)noise=np.random.uniform(low=-2e3,high=2e3,size=size)ax.plot(measurement+noise)plt.show()