

Note
Go to the endto download the full example code.
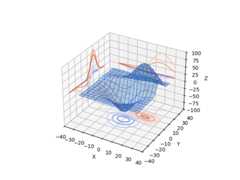
Project contour profiles onto a graph#
Demonstrates displaying a 3D surface while also projecting contour 'profiles'onto the 'walls' of the graph.SeeProject filled contour onto a graph for the filled version.
importmatplotlib.pyplotaspltfrommpl_toolkits.mplot3dimportaxes3dax=plt.figure().add_subplot(projection='3d')X,Y,Z=axes3d.get_test_data(0.05)# Plot the 3D surfaceax.plot_surface(X,Y,Z,edgecolor='royalblue',lw=0.5,rstride=8,cstride=8,alpha=0.3)# Plot projections of the contours for each dimension. By choosing offsets# that match the appropriate axes limits, the projected contours will sit on# the 'walls' of the graph.ax.contour(X,Y,Z,zdir='z',offset=-100,cmap='coolwarm')ax.contour(X,Y,Z,zdir='x',offset=-40,cmap='coolwarm')ax.contour(X,Y,Z,zdir='y',offset=40,cmap='coolwarm')ax.set(xlim=(-40,40),ylim=(-40,40),zlim=(-100,100),xlabel='X',ylabel='Y',zlabel='Z')plt.show()
Tags:plot-type: 3Dcomponent: axeslevel: intermediate