

Note
Go to the endto download the full example code.
Parasite Simple#
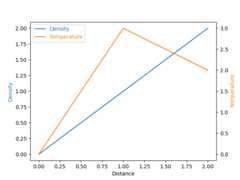
importmatplotlib.pyplotaspltfrommpl_toolkits.axes_grid1importhost_subplothost=host_subplot(111)par=host.twinx()host.set_xlabel("Distance")host.set_ylabel("Density")par.set_ylabel("Temperature")p1,=host.plot([0,1,2],[0,1,2],label="Density")p2,=par.plot([0,1,2],[0,3,2],label="Temperature")host.legend(labelcolor="linecolor")host.yaxis.label.set_color(p1.get_color())par.yaxis.label.set_color(p2.get_color())plt.show()