

Note
Go to the endto download the full example code.
Automatically setting tick positions#
Setting the behavior of tick auto-placement.
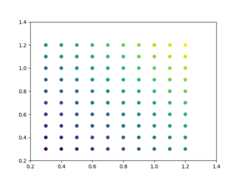
By default, Matplotlib will choose the number of ticks and tick positions sothat there is a reasonable number of ticks on the axis and they are locatedat "round" numbers.
As a result, there may be no ticks on the edges of the plot.
importmatplotlib.pyplotaspltimportnumpyasnpnp.random.seed(19680801)fig,ax=plt.subplots()dots=np.linspace(0.3,1.2,10)X,Y=np.meshgrid(dots,dots)x,y=X.ravel(),Y.ravel()ax.scatter(x,y,c=x+y)plt.show()

If you want to keep ticks at round numbers, and also have ticks at the edgesyou can switchrcParams["axes.autolimit_mode"] (default:'data') to 'round_numbers'. This expands theaxis limits to the next round number.
plt.rcParams['axes.autolimit_mode']='round_numbers'# Note: The limits are calculated at draw-time. Therefore, when using# :rc:`axes.autolimit_mode` in a context manager, it is important that# the ``show()`` command is within the context.fig,ax=plt.subplots()ax.scatter(x,y,c=x+y)plt.show()
The round numbers autolimit_mode is still respected if you set an additionalmargin around the data usingAxes.set_xmargin /Axes.set_ymargin:
fig,ax=plt.subplots()ax.scatter(x,y,c=x+y)ax.set_xmargin(0.8)plt.show()

Total running time of the script: (0 minutes 1.178 seconds)