

Note
Go to the endto download the full example code.
Separate calculation and plotting of boxplots#
Drawing aboxplot for a given data set, consists of two main operations,that can also be used separately:
Calculating the boxplot statistics:
matplotlib.cbook.boxplot_statsDrawing the boxplot:
matplotlib.axes.Axes.bxp
Thus,ax.boxplot(data) is equivalent to
All styling keyword arguments are identical betweenboxplot andbxp, and they are passed through fromboxplot tobxp. However, thetick_labels parameter ofboxplottranslates to a genericlabels parameter inboxplot_stats, because the labels aredata-related and attached to the returned per-dataset dictionaries.
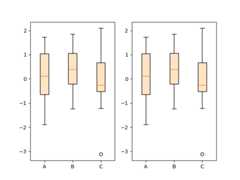
The following code demonstrates the equivalence between the two methods.
importmatplotlib.pyplotaspltimportnumpyasnpfrommatplotlibimportcbooknp.random.seed(19680801)data=np.random.randn(20,3)fig,(ax1,ax2)=plt.subplots(1,2)# single boxplot callax1.boxplot(data,tick_labels=['A','B','C'],patch_artist=True,boxprops={'facecolor':'bisque'})# separate calculation of statistics and plottingstats=cbook.boxplot_stats(data,labels=['A','B','C'])ax2.bxp(stats,patch_artist=True,boxprops={'facecolor':'bisque'})
Using the separate functions allows to pre-calculate statistics, in case you needthem explicitly for other purposes, or to reuse the statistics for multiple plots.
Conversely, you can also use thebxp function directly, if you alreadyhave the statistical parameters:

Tags:plot-type: specialtydomain: statistics
References
The use of the following functions, methods, classes and modules is shownin this example: