

Note
Go to the endto download the full example code.
Simple axis pad#
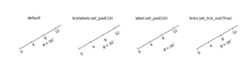
importmatplotlib.pyplotaspltimportnumpyasnpfrommatplotlib.projectionsimportPolarAxesfrommatplotlib.transformsimportAffine2Dimportmpl_toolkits.axisartistasaxisartistfrommpl_toolkits.axisartistimportangle_helper,grid_finderfrommpl_toolkits.axisartist.grid_helper_curvelinearimportGridHelperCurveLineardefsetup_axes(fig,rect):"""Polar projection, but in a rectangular box."""# see demo_curvelinear_grid.py for detailsgrid_helper=GridHelperCurveLinear(Affine2D().scale(np.pi/180.,1.)+PolarAxes.PolarTransform(),extreme_finder=angle_helper.ExtremeFinderCycle(20,20,lon_cycle=360,lat_cycle=None,lon_minmax=None,lat_minmax=(0,np.inf),),grid_locator1=angle_helper.LocatorDMS(12),grid_locator2=grid_finder.MaxNLocator(5),tick_formatter1=angle_helper.FormatterDMS(),)ax=fig.add_subplot(rect,axes_class=axisartist.Axes,grid_helper=grid_helper,aspect=1,xlim=(-5,12),ylim=(-5,10))ax.axis[:].set_visible(False)returnaxdefadd_floating_axis1(ax1):ax1.axis["lat"]=axis=ax1.new_floating_axis(0,30)axis.label.set_text(r"$\theta = 30^{\circ}$")axis.label.set_visible(True)returnaxisdefadd_floating_axis2(ax1):ax1.axis["lon"]=axis=ax1.new_floating_axis(1,6)axis.label.set_text(r"$r = 6$")axis.label.set_visible(True)returnaxisfig=plt.figure(figsize=(9,3.))fig.subplots_adjust(left=0.01,right=0.99,bottom=0.01,top=0.99,wspace=0.01,hspace=0.01)defann(ax1,d):ax1.annotate(d,(0.5,1),(5,-5),xycoords="axes fraction",textcoords="offset points",va="top",ha="center")ax1=setup_axes(fig,rect=141)axis=add_floating_axis1(ax1)ann(ax1,r"default")ax1=setup_axes(fig,rect=142)axis=add_floating_axis1(ax1)axis.major_ticklabels.set_pad(10)ann(ax1,r"ticklabels.set_pad(10)")ax1=setup_axes(fig,rect=143)axis=add_floating_axis1(ax1)axis.label.set_pad(20)ann(ax1,r"label.set_pad(20)")ax1=setup_axes(fig,rect=144)axis=add_floating_axis1(ax1)axis.major_ticks.set_tick_out(True)ann(ax1,"ticks.set_tick_out(True)")plt.show()