

Note
Go to the endto download the full example code.
axis_direction demo#
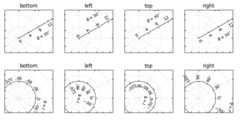
importmatplotlib.pyplotaspltimportnumpyasnpfrommatplotlib.projectionsimportPolarAxesfrommatplotlib.transformsimportAffine2Dimportmpl_toolkits.axisartistasaxisartistfrommpl_toolkits.axisartistimportangle_helper,grid_finderfrommpl_toolkits.axisartist.grid_helper_curvelinearimportGridHelperCurveLineardefsetup_axes(fig,rect):"""Polar projection, but in a rectangular box."""# see demo_curvelinear_grid.py for detailsgrid_helper=GridHelperCurveLinear(Affine2D().scale(np.pi/180.,1.)+PolarAxes.PolarTransform(),extreme_finder=angle_helper.ExtremeFinderCycle(20,20,lon_cycle=360,lat_cycle=None,lon_minmax=None,lat_minmax=(0,np.inf),),grid_locator1=angle_helper.LocatorDMS(12),grid_locator2=grid_finder.MaxNLocator(5),tick_formatter1=angle_helper.FormatterDMS(),)ax=fig.add_subplot(rect,axes_class=axisartist.Axes,grid_helper=grid_helper,aspect=1,xlim=(-5,12),ylim=(-5,10))ax.axis[:].toggle(ticklabels=False)ax.grid(color=".9")returnaxdefadd_floating_axis1(ax):ax.axis["lat"]=axis=ax.new_floating_axis(0,30)axis.label.set_text(r"$\theta = 30^{\circ}$")axis.label.set_visible(True)returnaxisdefadd_floating_axis2(ax):ax.axis["lon"]=axis=ax.new_floating_axis(1,6)axis.label.set_text(r"$r = 6$")axis.label.set_visible(True)returnaxisfig=plt.figure(figsize=(8,4),layout="constrained")fori,dinenumerate(["bottom","left","top","right"]):ax=setup_axes(fig,rect=241+i)axis=add_floating_axis1(ax)axis.set_axis_direction(d)ax.set(title=d)fori,dinenumerate(["bottom","left","top","right"]):ax=setup_axes(fig,rect=245+i)axis=add_floating_axis2(ax)axis.set_axis_direction(d)ax.set(title=d)plt.show()
Total running time of the script: (0 minutes 1.244 seconds)