

Note
Go to the endto download the full example code.
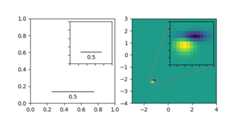
Inset locator demo 2#
This demo shows how to create a zoomed inset viazoomed_inset_axes.In the first subplot anAnchoredSizeBar shows the zoom effect.In the second subplot a connection to the region of interest iscreated viamark_inset.
A version of the second subplot, not using the toolkit, is available inZoom region inset Axes.
importmatplotlib.pyplotaspltimportnumpyasnpfrommatplotlibimportcbookfrommpl_toolkits.axes_grid1.anchored_artistsimportAnchoredSizeBarfrommpl_toolkits.axes_grid1.inset_locatorimportmark_inset,zoomed_inset_axesfig,(ax,ax2)=plt.subplots(ncols=2,figsize=[6,3])# First subplot, showing an inset with a size bar.ax.set_aspect(1)axins=zoomed_inset_axes(ax,zoom=0.5,loc='upper right')# fix the number of ticks on the inset Axesaxins.yaxis.get_major_locator().set_params(nbins=7)axins.xaxis.get_major_locator().set_params(nbins=7)axins.tick_params(labelleft=False,labelbottom=False)defadd_sizebar(ax,size):asb=AnchoredSizeBar(ax.transData,size,str(size),loc="lower center",pad=0.1,borderpad=0.5,sep=5,frameon=False)ax.add_artist(asb)add_sizebar(ax,0.5)add_sizebar(axins,0.5)# Second subplot, showing an image with an inset zoom and a marked insetZ=cbook.get_sample_data("axes_grid/bivariate_normal.npy")# 15x15 arrayextent=(-3,4,-4,3)Z2=np.zeros((150,150))ny,nx=Z.shapeZ2[30:30+ny,30:30+nx]=Zax2.imshow(Z2,extent=extent,origin="lower")axins2=zoomed_inset_axes(ax2,zoom=6,loc="upper right")axins2.imshow(Z2,extent=extent,origin="lower")# subregion of the original imagex1,x2,y1,y2=-1.5,-0.9,-2.5,-1.9axins2.set_xlim(x1,x2)axins2.set_ylim(y1,y2)# fix the number of ticks on the inset Axesaxins2.yaxis.get_major_locator().set_params(nbins=7)axins2.xaxis.get_major_locator().set_params(nbins=7)axins2.tick_params(labelleft=False,labelbottom=False)# draw a bbox of the region of the inset Axes in the parent Axes and# connecting lines between the bbox and the inset Axes areamark_inset(ax2,axins2,loc1=2,loc2=4,fc="none",ec="0.5")plt.show()