

Note
Go to the endto download the full example code.
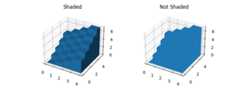
Demo of 3D bar charts#
A basic demo of how to plot 3D bars with and without shading.
importmatplotlib.pyplotaspltimportnumpyasnp# set up the figure and Axesfig=plt.figure(figsize=(8,3))ax1=fig.add_subplot(121,projection='3d')ax2=fig.add_subplot(122,projection='3d')# fake data_x=np.arange(4)_y=np.arange(5)_xx,_yy=np.meshgrid(_x,_y)x,y=_xx.ravel(),_yy.ravel()top=x+ybottom=np.zeros_like(top)width=depth=1ax1.bar3d(x,y,bottom,width,depth,top,shade=True)ax1.set_title('Shaded')ax2.bar3d(x,y,bottom,width,depth,top,shade=False)ax2.set_title('Not Shaded')plt.show()
Tags:plot-type: 3Dstyling: textureplot-type: barlevel: beginner