

Note
Go to the endto download the full example code.
Artist tutorial#
Using Artist objects to render on the canvas.
There are three layers to the Matplotlib API.
the
matplotlib.backend_bases.FigureCanvasis the area onto whichthe figure is drawnthe
matplotlib.backend_bases.Rendereris the object which knows howto draw on thematplotlib.backend_bases.FigureCanvasand the
matplotlib.artist.Artistis the object that knows how to usea renderer to paint onto the canvas.
Thematplotlib.backend_bases.FigureCanvas andmatplotlib.backend_bases.Renderer handle all the details oftalking to user interface toolkits likewxPython or drawing languages like PostScript®, andtheArtist handles all the high level constructs like representingand laying out the figure, text, and lines. The typical user willspend 95% of their time working with theArtists.
There are two types ofArtists: primitives and containers. The primitivesrepresent the standard graphical objects we want to paint onto our canvas:Line2D,Rectangle,Text,AxesImage, etc., andthe containers are places to put them (Axis,Axes andFigure). Thestandard use is to create aFigure instance, usetheFigure to create one or moreAxesinstances, and use theAxes instancehelper methods to create the primitives. In the example below, we create aFigure instance usingmatplotlib.pyplot.figure(), which is aconvenience method for instantiatingFigure instances and connecting themwith your user interface or drawing toolkitFigureCanvas. As we willdiscuss below, this is not necessary -- you can work directly with PostScript,PDF Gtk+, or wxPythonFigureCanvas instances, instantiate yourFiguresdirectly and connect them yourselves -- but since we are focusing here on theArtist API we'll letpyplot handle some of those detailsfor us:
importmatplotlib.pyplotaspltfig=plt.figure()ax=fig.add_subplot(2,1,1)# two rows, one column, first plot
TheAxes is probably the most importantclass in the Matplotlib API, and the one you will be working with mostof the time. This is because theAxes is the plotting area intowhich most of the objects go, and theAxes has many special helpermethods (plot(),text(),hist(),imshow()) to create the most commongraphics primitives (Line2D,Text,Rectangle,AxesImage, respectively). These helper methodswill take your data (e.g.,numpy arrays and strings) and createprimitiveArtist instances as needed (e.g.,Line2D), add them tothe relevant containers, and draw them when requested. If you want to createanAxes at an arbitrary location, simply use theadd_axes() method which takes a listof[left,bottom,width,height] values in 0-1 relative figurecoordinates:
fig2=plt.figure()ax2=fig2.add_axes((0.15,0.1,0.7,0.3))
Continuing with our example:
In this example,ax is theAxes instance created by thefig.add_subplot call above and when you callax.plot, it creates aLine2D instance andadds it to theAxes. In the interactiveIPythonsession below, you can see that theAxes.lines list is length one andcontains the same line that was returned by theline,=ax.plot... call:
If you make subsequent calls toax.plot (and the hold state is "on"which is the default) then additional lines will be added to the list.You can remove a line later by calling itsremove method:
The Axes also has helper methods to configure and decorate the x-axisand y-axis tick, tick labels and axis labels:
When you callax.set_xlabel,it passes the information on theTextinstance of theXAxis. EachAxesinstance contains anXAxis and aYAxis instance, which handle the layout anddrawing of the ticks, tick labels and axis labels.
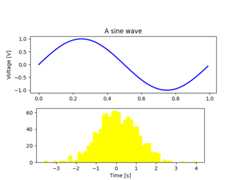
Try creating the figure below.
importmatplotlib.pyplotaspltimportnumpyasnpfig=plt.figure()fig.subplots_adjust(top=0.8)ax1=fig.add_subplot(211)ax1.set_ylabel('Voltage [V]')ax1.set_title('A sine wave')t=np.arange(0.0,1.0,0.01)s=np.sin(2*np.pi*t)line,=ax1.plot(t,s,color='blue',lw=2)# Fixing random state for reproducibilitynp.random.seed(19680801)ax2=fig.add_axes((0.15,0.1,0.7,0.3))n,bins,patches=ax2.hist(np.random.randn(1000),50,facecolor='yellow',edgecolor='yellow')ax2.set_xlabel('Time [s]')plt.show()
Customizing your objects#
Every element in the figure is represented by a MatplotlibArtist, and each has an extensive list ofproperties to configure its appearance. The figure itself contains aRectangle exactly the size of the figure,which you can use to set the background color and transparency of thefigures. Likewise, eachAxes bounding box(the standard white box with black edges in the typical Matplotlibplot, has aRectangle instance that determines the color,transparency, and other properties of the Axes. These instances arestored as member variablesFigure.patch andAxes.patch("Patch" is a name inherited from MATLAB, and is a 2D "patch"of color on the figure, e.g., rectangles, circles and polygons).Every MatplotlibArtist has the following properties
Property | Description |
|---|---|
alpha | The transparency - a scalar from 0-1 |
animated | A boolean that is used to facilitate animated drawing |
axes | The Axes that the Artist lives in, possibly None |
clip_box | The bounding box that clips the Artist |
clip_on | Whether clipping is enabled |
clip_path | The path the artist is clipped to |
contains | A picking function to test whether the artist contains the pickpoint |
figure | The figure instance the artist lives in, possibly None |
label | A text label (e.g., for auto-labeling) |
picker | A python object that controls object picking |
transform | The transformation |
visible | A boolean whether the artist should be drawn |
zorder | A number which determines the drawing order |
rasterized | Boolean; Turns vectors into raster graphics (for compression &EPS transparency) |
Each of the properties is accessed with an old-fashioned setter orgetter (yes we know this irritates Pythonistas and we plan to supportdirect access via properties or traits but it hasn't been done yet).For example, to multiply the current alpha by a half:
a=o.get_alpha()o.set_alpha(0.5*a)
If you want to set a number of properties at once, you can also usetheset method with keyword arguments. For example:
o.set(alpha=0.5,zorder=2)
If you are working interactively at the python shell, a handy way toinspect theArtist properties is to use thematplotlib.artist.getp() function (simplygetp() in pyplot), which lists the propertiesand their values. This works for classes derived fromArtist aswell, e.g.,Figure andRectangle. Here are theFigure rectangleproperties mentioned above:
In [149]:matplotlib.artist.getp(fig.patch) agg_filter = None alpha = None animated = False antialiased or aa = False bbox = Bbox(x0=0.0, y0=0.0, x1=1.0, y1=1.0) capstyle = butt children = [] clip_box = None clip_on = True clip_path = None contains = None data_transform = BboxTransformTo( TransformedBbox( Bbox... edgecolor or ec = (1.0, 1.0, 1.0, 1.0) extents = Bbox(x0=0.0, y0=0.0, x1=640.0, y1=480.0) facecolor or fc = (1.0, 1.0, 1.0, 1.0) figure = Figure(640x480) fill = True gid = None hatch = None height = 1 in_layout = False joinstyle = miter label = linestyle or ls = solid linewidth or lw = 0.0 patch_transform = CompositeGenericTransform( BboxTransformTo( ... path = Path(array([[0., 0.], [1., 0.], [1.,... path_effects = [] picker = None rasterized = None sketch_params = None snap = None transform = CompositeGenericTransform( CompositeGenericTra... transformed_clip_path_and_affine = (None, None) url = None verts = [[ 0. 0.] [640. 0.] [640. 480.] [ 0. 480.... visible = True width = 1 window_extent = Bbox(x0=0.0, y0=0.0, x1=640.0, y1=480.0) x = 0 xy = (0, 0) y = 0 zorder = 1
The docstrings for all of the classes also contain theArtistproperties, so you can consult the interactive "help" or thematplotlib.artist for a listing of properties for a given object.
Object containers#
Now that we know how to inspect and set the properties of a givenobject we want to configure, we need to know how to get at that object.As mentioned in the introduction, there are two kinds of objects:primitives and containers. The primitives are usually the things youwant to configure (the font of aTextinstance, the width of aLine2D) althoughthe containers also have some properties as well -- for example theAxesArtist is acontainer that contains many of the primitives in your plot, but italso has properties like thexscale to control whether the xaxisis 'linear' or 'log'. In this section we'll review where the variouscontainer objects store theArtists that you want to get at.
Figure container#
The top level containerArtist is thematplotlib.figure.Figure, and it contains everything in thefigure. The background of the figure is aRectangle which is stored inFigure.patch. Asyou add subplots (add_subplot()) andAxes (add_axes()) to the figurethese will be appended to theFigure.axes. These are also returned by themethods that create them:
In [156]:fig=plt.figure()In [157]:ax1=fig.add_subplot(211)In [158]:ax2=fig.add_axes((0.1,0.1,0.7,0.3))In [159]:ax1Out[159]:<Axes:>In [160]:print(fig.axes)[<Axes:>, <matplotlib.axes._axes.Axes object at 0x7f0768702be0>]
Because the figure maintains the concept of the "current Axes" (seeFigure.gca andFigure.sca) to support thepylab/pyplot state machine, you should not insert or remove Axesdirectly from the Axes list, but rather use theadd_subplot() andadd_axes() methods to insert, and theAxes.remove method to delete. You arefree however, to iterate over the list of Axes or index into it to getaccess toAxes instances you want to customize. Here is anexample which turns all the Axes grids on:
The figure also has its ownimages,lines,patches andtextattributes, which you can use to add primitives directly. When doing so, thedefault coordinate system for theFigure will simply be in pixels (whichis not usually what you want). If you instead use Figure-level methods to addArtists (e.g., usingFigure.text to add text), then the default coordinatesystem will be "figure coordinates" where (0, 0) is the bottom-left of thefigure and (1, 1) is the top-right of the figure.
As with allArtists, you can control this coordinate system by settingthe transform property. You can explicitly use "figure coordinates" bysetting theArtist transform tofig.transFigure:
importmatplotlib.linesaslinesfig=plt.figure()l1=lines.Line2D([0,1],[0,1],transform=fig.transFigure,figure=fig)l2=lines.Line2D([0,1],[1,0],transform=fig.transFigure,figure=fig)fig.lines.extend([l1,l2])plt.show()

Here is a summary of the Artists the Figure contains
Figure attribute | Description |
|---|---|
axes | A list of |
patch | The |
images | A list of |
legends | A list of Figure |
lines | A list of Figure |
patches | A list of Figure |
texts | A list Figure |
Axes container#
Thematplotlib.axes.Axes is the center of the Matplotlibuniverse -- it contains the vast majority of all theArtists usedin a figure with many helper methods to create and add theseArtists to itself, as well as helper methods to access andcustomize theArtists it contains. Like theFigure, it contains aPatchmatplotlib.axes.Axes.patch which is aRectangle for Cartesian coordinates and aCircle for polar coordinates; this patchdetermines the shape, background and border of the plotting region:
ax=fig.add_subplot()rect=ax.patch# a Rectangle instancerect.set_facecolor('green')
When you call a plotting method, e.g., the canonicalplot and pass in arrays or lists of values, themethod will create amatplotlib.lines.Line2D instance, update the line withall theLine2D properties passed as keyword arguments, add the line totheAxes, and return it to you:
plot returns a list of lines because you can pass in multiple x, ypairs to plot, and we are unpacking the first element of the lengthone list into the line variable. The line has been added to theAxes.lines list:
In [229]:print(ax.lines)[<matplotlib.lines.Line2D at 0xd378b0c>]
Similarly, methods that create patches, likebar() creates a list of rectangles, willadd the patches to theAxes.patches list:
You should not add objects directly to theAxes.lines orAxes.patcheslists, because theAxes needs to do a few things when it creates and addsan object:
It sets the
figureandaxesproperty of theArtist;It sets the default
Axestransformation (unless one is already set);It inspects the data contained in the
Artistto update the datastructures controlling auto-scaling, so that the view limits can beadjusted to contain the plotted data.
You can, nonetheless, create objects yourself and add them directly to theAxes using helper methods likeadd_line andadd_patch. Here is an annotated interactive sessionillustrating what is going on:
In [262]:fig,ax=plt.subplots()# create a rectangle instanceIn [263]:rect=matplotlib.patches.Rectangle((1,1),width=5,height=12)# by default the Axes instance is NoneIn [264]:print(rect.axes)None# and the transformation instance is set to the "identity transform"In [265]:print(rect.get_data_transform())IdentityTransform()# now we add the Rectangle to the AxesIn [266]:ax.add_patch(rect)# and notice that the ax.add_patch method has set the Axes# instanceIn [267]:print(rect.axes)Axes(0.125,0.1;0.775x0.8)# and the transformation has been set tooIn [268]:print(rect.get_data_transform())CompositeGenericTransform( TransformWrapper( BlendedAffine2D( IdentityTransform(), IdentityTransform())), CompositeGenericTransform( BboxTransformFrom( TransformedBbox( Bbox(x0=0.0, y0=0.0, x1=1.0, y1=1.0), TransformWrapper( BlendedAffine2D( IdentityTransform(), IdentityTransform())))), BboxTransformTo( TransformedBbox( Bbox(x0=0.125, y0=0.10999999999999999, x1=0.9, y1=0.88), BboxTransformTo( TransformedBbox( Bbox(x0=0.0, y0=0.0, x1=6.4, y1=4.8), Affine2D( [[100. 0. 0.] [ 0. 100. 0.] [ 0. 0. 1.]])))))))# the default Axes transformation is ax.transDataIn [269]:print(ax.transData)CompositeGenericTransform( TransformWrapper( BlendedAffine2D( IdentityTransform(), IdentityTransform())), CompositeGenericTransform( BboxTransformFrom( TransformedBbox( Bbox(x0=0.0, y0=0.0, x1=1.0, y1=1.0), TransformWrapper( BlendedAffine2D( IdentityTransform(), IdentityTransform())))), BboxTransformTo( TransformedBbox( Bbox(x0=0.125, y0=0.10999999999999999, x1=0.9, y1=0.88), BboxTransformTo( TransformedBbox( Bbox(x0=0.0, y0=0.0, x1=6.4, y1=4.8), Affine2D( [[100. 0. 0.] [ 0. 100. 0.] [ 0. 0. 1.]])))))))# notice that the xlimits of the Axes have not been changedIn [270]:print(ax.get_xlim())(0.0, 1.0)# but the data limits have been updated to encompass the rectangleIn [271]:print(ax.dataLim.bounds)(1.0, 1.0, 5.0, 12.0)# we can manually invoke the auto-scaling machineryIn [272]:ax.autoscale_view()# and now the xlim are updated to encompass the rectangle, plus marginsIn [273]:print(ax.get_xlim())(0.75, 6.25)# we have to manually force a figure drawIn [274]:fig.canvas.draw()
There are many, manyAxes helper methods for creating primitiveArtists and adding them to their respective containers. The tablebelow summarizes a small sampling of them, the kinds ofArtist theycreate, and where they store them
Axes helper method | Artist | Container |
|---|---|---|
| ax.texts | |
| ax.patches | |
| ax.lines andax.patches | |
| ax.patches | |
| ax.patches | |
| ax.images | |
| ax.get_legend() | |
| ax.lines | |
| ax.collections | |
| ax.texts |
In addition to all of theseArtists, theAxes contains twoimportantArtist containers: theXAxisandYAxis, which handle the drawing of theticks and labels. These are stored as instance variablesmatplotlib.axes.Axes.xaxis andmatplotlib.axes.Axes.yaxis. TheXAxis andYAxiscontainers will be detailed below, but note that theAxes containsmany helper methods which forward calls on to theAxis instances, so you often do not need towork with them directly unless you want to. For example, you can setthe font color of theXAxis ticklabels using theAxes helpermethod:
Below is a summary of the Artists that theAxes contains
Axes attribute | Description |
|---|---|
artists | An |
patch |
|
collections | An |
images | An |
lines | An |
patches | An |
texts | An |
xaxis | A |
yaxis | A |
The legend can be accessed byget_legend,
Axis containers#
Thematplotlib.axis.Axis instances handle the drawing of thetick lines, the grid lines, the tick labels and the axis label. Youcan configure the left and right ticks separately for the y-axis, andthe upper and lower ticks separately for the x-axis. TheAxisalso stores the data and view intervals used in auto-scaling, panningand zooming, as well as theLocator andFormatter instances which control wherethe ticks are placed and how they are represented as strings.
EachAxis object contains alabel attribute(this is whatpyplot modifies in calls toxlabel andylabel) as well as a list of major and minor ticks. The ticks areaxis.XTick andaxis.YTick instances, which contain the actual line andtext primitives that render the ticks and ticklabels. Because the ticks aredynamically created as needed (e.g., when panning and zooming), you shouldaccess the lists of major and minor ticks through their accessor methodsaxis.Axis.get_major_ticks andaxis.Axis.get_minor_ticks. Althoughthe ticks contain all the primitives and will be covered below,Axisinstances have accessor methods that return the tick lines, tick labels, ticklocations etc.:

array([0. , 0.2, 0.4, 0.6, 0.8, 1. ])
[Text(0.0, 0, '0.0'), Text(0.2, 0, '0.2'), Text(0.4, 0, '0.4'), Text(0.6000000000000001, 0, '0.6'), Text(0.8, 0, '0.8'), Text(1.0, 0, '1.0')]
note there are twice as many ticklines as labels because by default there aretick lines at the top and bottom but only tick labels below the xaxis;however, this can be customized.
<a list of 12 Line2D ticklines objects>
And with the above methods, you only get lists of major ticks back bydefault, but you can also ask for the minor ticks:
axis.get_ticklabels(minor=True)axis.get_ticklines(minor=True)
<a list of 0 Line2D ticklines objects>
Here is a summary of some of the useful accessor methods of theAxis(these have corresponding setters where useful, such asset_major_formatter().)
Axis accessor method | Description |
|---|---|
The scale of the Axis, e.g., 'log' or 'linear' | |
The interval instance of the Axis view limits | |
The interval instance of the Axis data limits | |
A list of grid lines for the Axis | |
The Axis label - a | |
The Axis offset text - a | |
A list of | |
A list of | |
A list of Tick locations -keyword minor=True|False | |
The | |
The | |
The | |
The | |
A list of | |
A list of | |
Turn the grid on or off for the major or minorticks |
Here is an example, not recommended for its beauty, which customizesthe Axes and Tick properties.
# plt.figure creates a matplotlib.figure.Figure instancefig=plt.figure()rect=fig.patch# a rectangle instancerect.set_facecolor('lightgoldenrodyellow')ax1=fig.add_axes((0.1,0.3,0.4,0.4))rect=ax1.patchrect.set_facecolor('lightslategray')forlabelinax1.xaxis.get_ticklabels():# label is a Text instancelabel.set_color('red')label.set_rotation(45)label.set_fontsize(16)forlineinax1.yaxis.get_ticklines():# line is a Line2D instanceline.set_color('green')line.set_markersize(25)line.set_markeredgewidth(3)plt.show()

Tick containers#
Thematplotlib.axis.Tick is the final container object in ourdescent from theFigure to theAxes to theAxisto theTick. TheTick contains the tickand grid line instances, as well as the label instances for the upperand lower ticks. Each of these is accessible directly as an attributeof theTick.
Tick attribute | Description |
|---|---|
tick1line | A |
tick2line | A |
gridline | A |
label1 | A |
label2 | A |
Here is an example which sets the formatter for the right side ticks withdollar signs and colors them green on the right side of the yaxis.
importmatplotlib.pyplotaspltimportnumpyasnp# Fixing random state for reproducibilitynp.random.seed(19680801)fig,ax=plt.subplots()ax.plot(100*np.random.rand(20))# Use automatic StrMethodFormatterax.yaxis.set_major_formatter('${x:1.2f}')ax.yaxis.set_tick_params(which='major',labelcolor='green',labelleft=False,labelright=True)plt.show()

Total running time of the script: (0 minutes 1.274 seconds)