

Note
Go to the endto download the full example code.
plot_surface(X, Y, Z)#
Seeplot_surface.
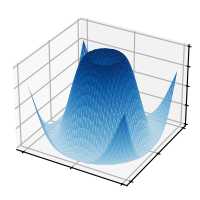
importmatplotlib.pyplotaspltimportnumpyasnpplt.style.use('_mpl-gallery')# Make dataX=np.arange(-5,5,0.25)Y=np.arange(-5,5,0.25)X,Y=np.meshgrid(X,Y)R=np.sqrt(X**2+Y**2)Z=np.sin(R)# Plot the surfacefig,ax=plt.subplots(subplot_kw={"projection":"3d"})ax.plot_surface(X,Y,Z,vmin=Z.min()*2,cmap="Blues")ax.set(xticklabels=[],yticklabels=[],zticklabels=[])plt.show()