

Note
Go to the endto download the full example code.
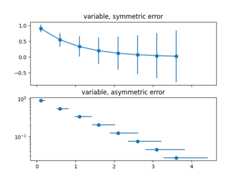
Different ways of specifying error bars#
Errors can be specified as a constant value (as shown inErrorbar function). However, this example demonstrateshow they vary by specifying arrays of error values.
If the rawx andy data have length N, there are two options:
- Array of shape (N,):
Error varies for each point, but the error values aresymmetric (i.e. the lower and upper values are equal).
- Array of shape (2, N):
Error varies for each point, and the lower and upper limits(in that order) are different (asymmetric case)
In addition, this example demonstrates how to use logscale with error bars.
importmatplotlib.pyplotaspltimportnumpyasnp# example datax=np.arange(0.1,4,0.5)y=np.exp(-x)# example error bar values that vary with x-positionerror=0.1+0.2*xfig,(ax0,ax1)=plt.subplots(nrows=2,sharex=True)ax0.errorbar(x,y,yerr=error,fmt='-o')ax0.set_title('variable, symmetric error')# error bar values w/ different -/+ errors that# also vary with the x-positionlower_error=0.4*errorupper_error=errorasymmetric_error=[lower_error,upper_error]ax1.errorbar(x,y,xerr=asymmetric_error,fmt='o')ax1.set_title('variable, asymmetric error')ax1.set_yscale('log')plt.show()
Tags:plot-type: errorbardomain: statistics
References
The use of the following functions, methods, classes and modules is shownin this example: