

Note
Go to the endto download the full example code.
Stackplots and streamgraphs#
Stackplots#
Stackplots draw multiple datasets as vertically stacked areas. This isuseful when the individual data values and additionally their cumulativevalue are of interest.
importmatplotlib.pyplotaspltimportnumpyasnpimportmatplotlib.tickerasmticker# data from United Nations World Population Prospects (Revision 2019)# https://population.un.org/wpp/, license: CC BY 3.0 IGOyear=[1950,1960,1970,1980,1990,2000,2010,2018]population_by_continent={'Africa':[.228,.284,.365,.477,.631,.814,1.044,1.275],'the Americas':[.340,.425,.519,.619,.727,.840,.943,1.006],'Asia':[1.394,1.686,2.120,2.625,3.202,3.714,4.169,4.560],'Europe':[.220,.253,.276,.295,.310,.303,.294,.293],'Oceania':[.012,.015,.019,.022,.026,.031,.036,.039],}fig,ax=plt.subplots()ax.stackplot(year,population_by_continent.values(),labels=population_by_continent.keys(),alpha=0.8)ax.legend(loc='upper left',reverse=True)ax.set_title('World population')ax.set_xlabel('Year')ax.set_ylabel('Number of people (billions)')# add tick at every 200 million peopleax.yaxis.set_minor_locator(mticker.MultipleLocator(.2))plt.show()

Streamgraphs#
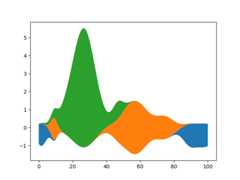
Using thebaseline parameter, you can turn an ordinary stacked area plotwith baseline 0 into a stream graph.
# Fixing random state for reproducibilitynp.random.seed(19680801)defgaussian_mixture(x,n=5):"""Return a random mixture of *n* Gaussians, evaluated at positions *x*."""defadd_random_gaussian(a):amplitude=1/(.1+np.random.random())dx=x[-1]-x[0]x0=(2*np.random.random()-.5)*dxz=10/(.1+np.random.random())/dxa+=amplitude*np.exp(-(z*(x-x0))**2)a=np.zeros_like(x)forjinrange(n):add_random_gaussian(a)returnax=np.linspace(0,100,101)ys=[gaussian_mixture(x)for_inrange(3)]fig,ax=plt.subplots()ax.stackplot(x,ys,baseline='wiggle')plt.show()
Tags:plot-type: stackplotlevel: intermediate
On this page