

Note
Go to the endto download the full example code.
Pick event demo#
You can enable picking by setting the "picker" property of an artist(for example, a Matplotlib Line2D, Text, Patch, Polygon, AxesImage,etc.)
There are a variety of meanings of the picker property:
None - picking is disabled for this artist (default)
bool - ifTrue then picking will be enabled and the artist will fire a pickevent if the mouse event is over the artist.
Setting
pickradiuswill add an epsilon tolerance in points and the artistwill fire off an event if its data is within epsilon of the mouse event. Forsome artists like lines and patch collections, the artist may provideadditional data to the pick event that is generated, for example, the indicesof the data within epsilon of the pick eventfunction - if picker is callable, it is a user supplied function whichdetermines whether the artist is hit by the mouse event.
hit,props=picker(artist,mouseevent)
to determine the hit test. If the mouse event is over the artist, returnhit=True and props is a dictionary of properties you want added to thePickEvent attributes.
After you have enabled an artist for picking by setting the "picker"property, you need to connect to the figure canvas pick_event to getpick callbacks on mouse press events. For example,
defpick_handler(event):mouseevent=event.mouseeventartist=event.artist# now do something with this...
The pick event (matplotlib.backend_bases.PickEvent) which is passed toyour callback is always fired with two attributes:
- mouseevent
the mouse event that generate the pick event.
The mouse event in turn has attributes like x and y (the coordinates indisplay space, such as pixels from left, bottom) and xdata, ydata (thecoords in data space). Additionally, you can get information aboutwhich buttons were pressed, which keys were pressed, which Axesthe mouse is over, etc. See matplotlib.backend_bases.MouseEventfor details.
- artist
the matplotlib.artist that generated the pick event.
Additionally, certain artists like Line2D and PatchCollection mayattach additional metadata like the indices into the data that meetthe picker criteria (for example, all the points in the line that are withinthe specified epsilon tolerance)
The examples below illustrate each of these methods.
Note
These examples exercises the interactive capabilities of Matplotlib, andthis will not appear in the static documentation. Please run this code onyour machine to see the interactivity.
You can copy and paste individual parts, or download the entire exampleusing the link at the bottom of the page.
Simple picking, lines, rectangles and text#
fig,(ax1,ax2)=plt.subplots(2,1)ax1.set_title('click on points, rectangles or text',picker=True)ax1.set_ylabel('ylabel',picker=True,bbox=dict(facecolor='red'))line,=ax1.plot(rand(100),'o',picker=True,pickradius=5)# Pick the rectangle.ax2.bar(range(10),rand(10),picker=True)forlabelinax2.get_xticklabels():# Make the xtick labels pickable.label.set_picker(True)defonpick1(event):ifisinstance(event.artist,Line2D):thisline=event.artistxdata=thisline.get_xdata()ydata=thisline.get_ydata()ind=event.indprint('onpick1 line:',np.column_stack([xdata[ind],ydata[ind]]))elifisinstance(event.artist,Rectangle):patch=event.artistprint('onpick1 patch:',patch.get_path())elifisinstance(event.artist,Text):text=event.artistprint('onpick1 text:',text.get_text())fig.canvas.mpl_connect('pick_event',onpick1)

Picking with a custom hit test function#
You can define custom pickers by setting picker to a callable function. Thefunction has the signature:
hit,props=func(artist,mouseevent)
to determine the hit test. If the mouse event is over the artist, returnhit=True andprops is a dictionary of properties you want added tothePickEvent attributes.
defline_picker(line,mouseevent):""" Find the points within a certain distance from the mouseclick in data coords and attach some extra attributes, pickx and picky which are the data points that were picked. """ifmouseevent.xdataisNone:returnFalse,dict()xdata=line.get_xdata()ydata=line.get_ydata()maxd=0.05d=np.sqrt((xdata-mouseevent.xdata)**2+(ydata-mouseevent.ydata)**2)ind,=np.nonzero(d<=maxd)iflen(ind):pickx=xdata[ind]picky=ydata[ind]props=dict(ind=ind,pickx=pickx,picky=picky)returnTrue,propselse:returnFalse,dict()defonpick2(event):print('onpick2 line:',event.pickx,event.picky)fig,ax=plt.subplots()ax.set_title('custom picker for line data')line,=ax.plot(rand(100),rand(100),'o',picker=line_picker)fig.canvas.mpl_connect('pick_event',onpick2)

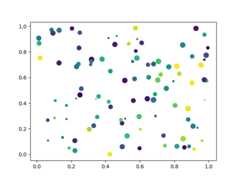
Picking on a scatter plot#
A scatter plot is backed by aPathCollection.
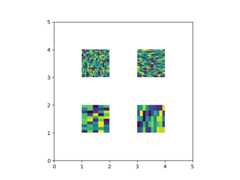
Picking images#
Images plotted usingAxes.imshow areAxesImageobjects.
fig,ax=plt.subplots()ax.imshow(rand(10,5),extent=(1,2,1,2),picker=True)ax.imshow(rand(5,10),extent=(3,4,1,2),picker=True)ax.imshow(rand(20,25),extent=(1,2,3,4),picker=True)ax.imshow(rand(30,12),extent=(3,4,3,4),picker=True)ax.set(xlim=(0,5),ylim=(0,5))defonpick4(event):artist=event.artistifisinstance(artist,AxesImage):im=artistA=im.get_array()print('onpick4 image',A.shape)fig.canvas.mpl_connect('pick_event',onpick4)plt.show()
Total running time of the script: (0 minutes 1.665 seconds)