

Note
Go to the endto download the full example code.
plot_wireframe(X, Y, Z)#
Seeplot_wireframe.
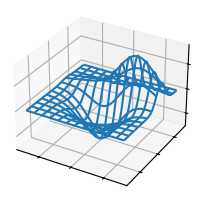
importmatplotlib.pyplotaspltfrommpl_toolkits.mplot3dimportaxes3dplt.style.use('_mpl-gallery')# Make dataX,Y,Z=axes3d.get_test_data(0.05)# Plotfig,ax=plt.subplots(subplot_kw={"projection":"3d"})ax.plot_wireframe(X,Y,Z,rstride=10,cstride=10)ax.set(xticklabels=[],yticklabels=[],zticklabels=[])plt.show()