

Note
Go to the endto download the full example code.
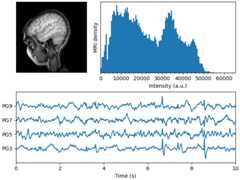
MRI with EEG#
Displays a set of subplots with an MRI image, its intensityhistogram and some EEG traces.
importmatplotlib.pyplotaspltimportnumpyasnpimportmatplotlib.cbookascbookfig,axd=plt.subplot_mosaic([["image","density"],["EEG","EEG"]],layout="constrained",# "image" will contain a square image. We fine-tune the width so that# there is no excess horizontal or vertical margin around the image.width_ratios=[1.05,2],)# Load the MRI data (256x256 16-bit integers)withcbook.get_sample_data('s1045.ima.gz')asdfile:im=np.frombuffer(dfile.read(),np.uint16).reshape((256,256))# Plot the MRI imageaxd["image"].imshow(im,cmap="gray")axd["image"].axis('off')# Plot the histogram of MRI intensityim=im[im.nonzero()]# Ignore the backgroundaxd["density"].hist(im,bins=np.arange(0,2**16+1,512))axd["density"].set(xlabel='Intensity (a.u.)',xlim=(0,2**16),ylabel='MRI density',yticks=[])axd["density"].minorticks_on()# Load the EEG datan_samples,n_rows=800,4withcbook.get_sample_data('eeg.dat')aseegfile:data=np.fromfile(eegfile,dtype=float).reshape((n_samples,n_rows))t=10*np.arange(n_samples)/n_samples# Plot the EEGaxd["EEG"].set_xlabel('Time (s)')axd["EEG"].set_xlim(0,10)dy=(data.min()-data.max())*0.7# Crowd them a bit.axd["EEG"].set_ylim(-dy,n_rows*dy)axd["EEG"].set_yticks([0,dy,2*dy,3*dy],labels=['PG3','PG5','PG7','PG9'])fori,data_colinenumerate(data.T):axd["EEG"].plot(t,data_col+i*dy,color="C0")plt.show()