

Note
Go to the endto download the full example code.
Pick event demo 2#
Compute the mean (mu) and standard deviation (sigma) of 100 data sets and plotmu vs. sigma. When you click on one of the (mu, sigma) points, plot the rawdata from the dataset that generated this point.
Note
This example exercises the interactive capabilities of Matplotlib, and thiswill not appear in the static documentation. Please run this code on yourmachine to see the interactivity.
You can copy and paste individual parts, or download the entire exampleusing the link at the bottom of the page.
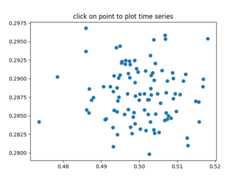
importmatplotlib.pyplotaspltimportnumpyasnp# Fixing random state for reproducibilitynp.random.seed(19680801)X=np.random.rand(100,1000)xs=np.mean(X,axis=1)ys=np.std(X,axis=1)fig,ax=plt.subplots()ax.set_title('click on point to plot time series')line,=ax.plot(xs,ys,'o',picker=True,pickradius=5)defonpick(event):ifevent.artist!=line:returnN=len(event.ind)ifnotN:returnfigi,axs=plt.subplots(N,squeeze=False)forax,dataindinzip(axs.flat,event.ind):ax.plot(X[dataind])ax.text(.05,.9,f'mu={xs[dataind]:1.3f}\nsigma={ys[dataind]:1.3f}',transform=ax.transAxes,va='top')ax.set_ylim(-0.5,1.5)figi.show()fig.canvas.mpl_connect('pick_event',onpick)plt.show()