

Note
Go to the endto download the full example code.
Custom spines with axisartist#
This example showcases the use ofaxisartist to draw spines at custompositions (here, aty=0).
Note, however, that it is simpler to achieve this effect using standardSpine methods, as demonstrated inCentered spines with arrows.
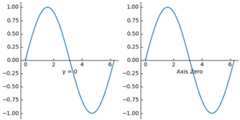
importmatplotlib.pyplotaspltimportnumpyasnpfrommpl_toolkitsimportaxisartistfig=plt.figure(figsize=(6,3),layout="constrained")# To construct Axes of two different classes, we need to use gridspec (or# MATLAB-style add_subplot calls).gs=fig.add_gridspec(1,2)ax0=fig.add_subplot(gs[0,0],axes_class=axisartist.Axes)# Make a new axis along the first (x) axis which passes through y=0.ax0.axis["y=0"]=ax0.new_floating_axis(nth_coord=0,value=0,axis_direction="bottom")ax0.axis["y=0"].toggle(all=True)ax0.axis["y=0"].label.set_text("y = 0")# Make other axis invisible.ax0.axis["bottom","top","right"].set_visible(False)# Alternatively, one can use AxesZero, which automatically sets up two# additional axis, named "xzero" (the y=0 axis) and "yzero" (the x=0 axis).ax1=fig.add_subplot(gs[0,1],axes_class=axisartist.axislines.AxesZero)# "xzero" and "yzero" default to invisible; make xzero axis visible.ax1.axis["xzero"].set_visible(True)ax1.axis["xzero"].label.set_text("Axis Zero")# Make other axis invisible.ax1.axis["bottom","top","right"].set_visible(False)# Draw some sample data.x=np.arange(0,2*np.pi,0.01)ax0.plot(x,np.sin(x))ax1.plot(x,np.sin(x))plt.show()