
Add data points
Usage
add_data_points(plot, data=all_rows(), shape=19, size=1, white_border=FALSE, dodge_width=NULL, preserve="total", rasterize=FALSE, rasterize_dpi=300,...)add_data_points_jitter(plot, data=all_rows(), shape=19, size=1, white_border=FALSE, dodge_width=NULL, jitter_width=0.2, jitter_height=0, preserve="total", rasterize=FALSE, rasterize_dpi=300,...)add_data_points_beeswarm(plot, data=all_rows(), shape=19, size=1, white_border=FALSE, cex=3, corral="wrap", corral.width=0.5, dodge_width=NULL, preserve="total", rasterize=FALSE, rasterize_dpi=300,...)Arguments
- plot
A
tidyplotgenerated with the functiontidyplot().- data
The data to be displayed in this layer. There are three options:
If
all_rows()(the default) the complete dataset is displayed.A
functionto subset the plot data. Seefilter_rows()and friends.A
data.frameto override the plot data.
- shape
An
integerbetween0and24, representing the shape of theplot symbol.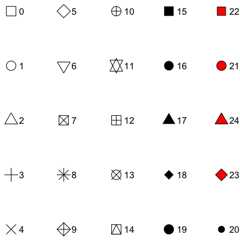
- size
A
numberrepresenting the size of the plot symbol. Typicalvalues range between1and3.- white_border
Whether to include a white border around data points. Defaults to
FALSE.- dodge_width
For adjusting the distance between grouped objects. Defaultsto
0.8for plots with at least one discrete axis and0for plots with twocontinuous axes.- preserve
Should dodging preserve the
"total"width of all elements ata position, or the width of a"single"element?- rasterize
If
FALSE(the default) the layer will be constructed ofvector shapes. IfTRUEthe layer will be rasterized to a pixel image. This canbe useful when plotting many individual objects (1,000 or more) compromisesthe performance of the generated PDF file.- rasterize_dpi
The resolution in dots per inch (dpi) used for rasteringthe layer if
rasterizeisTRUE. The default is300dpi.- ...
Arguments passed on to the
geomfunction.- jitter_width
Amount of random noise to be added to thehorizontal position of the of the data points. This can be useful to dealwith overplotting. Typical values range between
0and1.- jitter_height
Amount of random noise to be added to thevertical position of the of the data points. This can be useful to dealwith overplotting. Typical values range between
0and1.- cex
Scaling for adjusting point spacing (see
beeswarm::swarmx()).Values between 1 (default) and 3 tend to work best.- corral
Method used to adjust points that would be placed too widehorizontally. Options are
"none"(default),"gutter","wrap","random", and"omit".See Details below.- corral.width
Width of the corral, if not
"none". Default is0.9.
Details
add_data_points_beeswarm()is based onggbeeswarm::geom_beeswarm().Check there for additional arguments.add_data_points()and friends support rasterization. See examples andAdvanced plotting.add_data_points()and friends support data subsetting. See examples andAdvanced plotting.
Examples
study|>tidyplot(x=treatment, y=score, color=treatment)|>add_data_points() study|>tidyplot(x=treatment, y=score, color=treatment)|>add_data_points_jitter()
 study|>tidyplot(x=treatment, y=score, color=treatment)|>add_data_points_beeswarm()
 # Changing argumentsstudy|>tidyplot(x=treatment, y=score, color=treatment)|>add_data_points_jitter(jitter_width=1)
 animals|>tidyplot(x=weight, y=size)|>add_data_points(white_border=TRUE)
 animals|>tidyplot(x=weight, y=size)|>add_data_points(alpha=0.4)
 # Rasterizationanimals|>tidyplot(x=weight, y=size)|>add_data_points(rasterize=TRUE, rasterize_dpi=50)
 # Data subsettinganimals|>tidyplot(x=weight, y=size)|>add_data_points()|>add_data_points(data=filter_rows(size>300), color="red")