- Notifications
You must be signed in to change notification settings - Fork633
An interactive graphing library for R
License
Unknown, MIT licenses found
Licenses found
plotly/plotly.R
Folders and files
| Name | Name | Last commit message | Last commit date | |
|---|---|---|---|---|
Repository files navigation


An R package for creating interactive web graphics via the open sourceJavaScript graphing libraryplotly.js.

Install from CRAN:
install.packages("plotly")Or install the latest development version (on GitHub) via{remotes}:
remotes::install_github("plotly/plotly")
If you useggplot2,ggplotly()converts your static plots to an interactive web-based version!
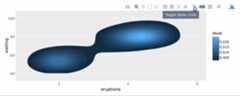
library(plotly)g<- ggplot(faithful, aes(x=eruptions,y=waiting))+ stat_density_2d(aes(fill=..level..),geom="polygon")+ xlim(1,6)+ ylim(40,100)ggplotly(g)

By default,ggplotly() tries to replicate the static ggplot2 versionexactly (before any interaction occurs), but sometimes you need greatercontrol over the interactive behavior. Theggplotly() function itselfhas some convenient “high-level” arguments, such asdynamicTicks,which tells plotly.js to dynamically recompute axes, when appropriate.Thestyle() function also comes in handy formodifying theunderlying traceattributes (e.g.hoveron) used to generate the plot:
gg<- ggplotly(g,dynamicTicks="y")style(gg,hoveron="points",hoverinfo="x+y+text",hoverlabel=list(bgcolor="white"))
Moreover, sinceggplotly() returns a plotly object, you can applyessentially any function from the R package on that object. Some usefulones includelayout() (forcustomizing thelayout),add_traces() (and its higher-leveladd_*() siblings, for exampleadd_polygons(), foradding newtraces/data),subplot() (forcombining multiple plotlyobjects),andplotly_json() (for inspecting the underlying JSON sent toplotly.js).
Theggplotly() function will also respect some “unofficial”ggplot2 aesthetics, namelytext (forcustomizing thetooltip),frame (forcreatinganimations),andids (for ensuring sensible smooth transitions).
Theplot_ly() function provides a more direct interface to plotly.jsso you can leverage more specialized chart types (e.g.,parallelcoordinates ormaps) or even some visualization that theggplot2 API won’t ever support (e.g., surface,mesh,trisurf, etc).
plot_ly(z=~volcano,type="surface")

To learn more about special features that the plotly R package provides (e.g.,client-side linking,shiny integration,editing and generating static images,custom events in JavaScript, and more), seehttps://plotly-r.com. You may already be familiar with existing plotly documentation (e.g.,https://plotly.com/r/), which is essentially a language-agnostic how-to guide for learning plotly.js, whereashttps://plotly-r.com is meant to be more wholistic tutorial written by and for the R user. The package itself ships with a number of demos (list them by runningdemo(package = "plotly")) and shiny/rmarkdown examples (list them by runningplotly_example("shiny") orplotly_example("rmd")).Carson also keeps numerousslide decks with useful examples and concepts.
Please read through ourcontributingguidelines.Included are directions for opening issues, asking questions,contributing changes to plotly, and our code ofconduct.
About
An interactive graphing library for R
Topics
Resources
License
Unknown, MIT licenses found
Licenses found
Code of conduct
Uh oh!
There was an error while loading.Please reload this page.
Stars
Watchers
Forks
Packages0
Uh oh!
There was an error while loading.Please reload this page.