- Notifications
You must be signed in to change notification settings - Fork7
项目技术栈趋势图
NotificationsYou must be signed in to change notification settings
phodal/techstack
Folders and files
| Name | Name | Last commit message | Last commit date | |
|---|---|---|---|---|
Repository files navigation
在线预览:http://phodal.github.io/techstack
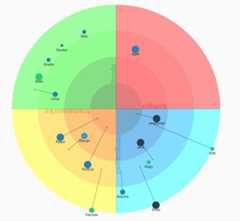
最后的效果如下图:
出于一些原因,我需要构建一个项目组相关的技术趋势图。首先也是想到了ThoughtWorks 技术雷达,然而我也发现了技术雷达只会发现一些新出现的技术,以及其对应的一些趋势。对于现有的技术栈的一些趋势不够明显,接着就只能去构建一个新的技术趋势图。
当然首选的框架也是D3.js,似乎会一些更好的工具,但是并不没有去尝试。
最开始的代码是基于https://github.com/simonellistonball/techradar这个库的,但是这其中的数据都是写好的。而在找到这个库之前,我也定义好了我的数据应该有的样子:
{"name":"Java","important":5,"usage":5,"current":4,"future":3,"description":"--------"}
对就于每个技术栈都会有名字、重要程度、使用程度、当前级别、未来级别、描述的字段。毕竟技术是有其应该有的趋势的,如果仅仅只是在上面用一些图形来表示可能又不够。
接着,又按照不同的维度区分为language、others、tools、frameworks四个维度
{"language":[{"name":"Java","important":5,"usage":5,"current":4,"future":3,"description":"--------"}],"tools":[{"name":"Linux","important":3,"usage":3,"current":3,"future":2,"description":"--------"}],"others":[{"name":"Agile","important":3,"usage":5,"current":3,"future":3,"description":"--------"}],"frameworks":[{"name":"Node.js","important":3,"usage":5,"current":3,"future":5,"description":"--------"}]}
而在上述的版本中,则有了我想要的箭头,尽管数据不合适,但是还是可以改的。
然后,我们的主要精力就是集中在parse上面的数据中,取出每个数据,按照不同的维度去放置技术栈,并进行一些转换。
varresults=[];for(varquadrantindata){$.each(data[quadrant],function(index,skill){results.push({name:skill.name,important:skill.important,usage:skill.usage,description:skill.description,trend:entry(quadrant,convertFractions(skill.current),convertFractions(skill.future))});})}
About
项目技术栈趋势图
Resources
Uh oh!
There was an error while loading.Please reload this page.
Stars
Watchers
Forks
Releases
No releases published
Packages0
No packages published
Uh oh!
There was an error while loading.Please reload this page.
