Uh oh!
There was an error while loading.Please reload this page.
- Notifications
You must be signed in to change notification settings - Fork2
Endpoint downtime detection, monitoring, and traffic simulation developer tool
License
oslabs-beta/DataDoc
Folders and files
| Name | Name | Last commit message | Last commit date | |
|---|---|---|---|---|
Repository files navigation
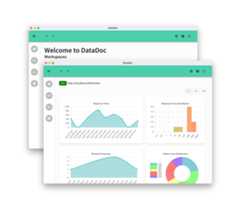
DataDoc is an endpoint monitoring, detection and traffic simulation tool that provides real-time metrics and customizable alert notifications.
- Node.js v18^
- Docker
This tool requires the npm packageexpress-endpoints-monitor to detect and gather metrics for endpoints in your Express application. To understand how to use this plugin, see thefull documentation.
Run the following terminal command in your project directory that you would like to begin monitoring:
npm install express-endpoints-monitorThis should have created a
express-endpoints-monitor/folder in yournode_modules/directoryWIP:Clone this repository. Unzip the file in a separate folder and open a terminal in this directory. Run the following commands:
npm installnpm run buildThis will install the needed dependences and build the desktop application.
Open your Express application file in a text editor. At the top of the file, import the plugin by adding:
const expMonitor = require("express-endpoints-monitor");This module comes with several functions to register endpoints with the monitoring application and begin log requests made to those endpoints.
In your file, include the following line:
app.use(expMonitor.gatherMetrics);This will record metrics for incoming requests and make them available to the metrics API which will be set up later.
Under an endpoint that you would like to begin monitoring, include the
expMonitor.registerEndpointmiddleware. For example, this may look like:app.get(..., expMonitor.registerEndpoint, ...);The order of this function in the middleware chain is not important. This middleware will stage this particular endpoint for exporting, and can be used in multiple endpoints.
Once all desired endpoints have been registered, they must be exported on the metrics server. In your
app.listendeclaration, add these lines to the passed-in callback function:app.listen(..., function callback() { ... expMonitor.exportEndpoints(); startMetricsServer(<METRICS_SERVER_PORT>))This will start up a metrics server on
METRICS_SERVER_PORT. If this argument is not specified, it will resolve to9991. The server includes several endpoints, one of which isGET /endpointswhich responds with the list of registered endpoints in JSON format.Alternatively, if you would like to export all endpoints, you may replace the above snippet with the
exportAllEndpointsfunction:app.listen(..., function callback() { ... expMonitor.exportAllEndpoints(); startMetricsServer(<METRICS_SERVER_PORT>))This will expose all endpoints regardless of whether they include the
registerEndpointmiddleware.Your application is ready to start monitoring! To verify your setup, use a browser or API testing tool to interact with the metrics API started at
http://localhost:<METRICS_SERVER_PORT>. The list of available endpoints is:GET /endpointsGET /metricsDELETE /metrics
To see the full use of the library, see thenpm page.
In your localDataDoc folder, run the following command:
docker compose upThe-d flag may be supplied to detach the instance from the terminal.
In your local
DataDocfolder, run the following command if you haven't during the installation steps:npm buildThis command only needs to be run once.
WIP: In the same folder, run the following command to start the desktop application:
npm start
About
Endpoint downtime detection, monitoring, and traffic simulation developer tool
Topics
Resources
License
Code of conduct
Contributing
Security policy
Uh oh!
There was an error while loading.Please reload this page.
Stars
Watchers
Forks
Releases
Sponsor this project
Uh oh!
There was an error while loading.Please reload this page.
Packages0
Uh oh!
There was an error while loading.Please reload this page.
Contributors4
Uh oh!
There was an error while loading.Please reload this page.


