- Notifications
You must be signed in to change notification settings - Fork597
🚀 10x easier, 🚀 140x lower storage cost, 🚀 high performance, 🚀 petabyte scale - Elasticsearch/Splunk/Datadog alternative for 🚀 (logs, metrics, traces, RUM, Error tracking, Session replay).
License
openobserve/openobserve
Folders and files
| Name | Name | Last commit message | Last commit date | |
|---|---|---|---|---|
Repository files navigation
🚀 10x easier, 🚀 140x lower storage cost, 🚀 high performance, 🚀 petabyte scale - Elasticsearch/Splunk/Datadog alternative for 🚀 (logs, metrics, traces).
OpenObserve (O2 for short) is a cloud-native observability platform built specifically for logs, metrics, traces, analytics, RUM (Real User Monitoring - Performance, Errors, Session Replay) designed to work at petabyte scale.
It is straightforward and easy to operate, in contrast to Elasticsearch, which requires understanding and tuning numerous settings. Get OpenObserve up and running in under 2 minutes.
OpenObserve serves as a seamless replacement for Elasticsearch for users who ingest data using APIs and perform searches. OpenObserve comes with its own user interface, eliminating the need for separate installation.
You can reduce your log storage costs by ~140x compared to Elasticsearch by using OpenObserve. Below, we present the results from pushing logs from our production Kubernetes cluster to both Elasticsearch and OpenObserve using Fluent Bit.
- Logs, Metrics, Traces: Comprehensive support for various data types.
- OpenTelemetry Support: Full compatibility with OTLP for logs, metrics, and traces.
- Real User Monitoring (RUM): Includes performance tracking, error logging, and session replay.
- Dashboards, Reports, Alerts: Features over 18 different chart types for comprehensive data visualization for on-the-fly analysis and reporting along with alerting.
- Pipelines: Enrich, redact, reduce, normalize data on the fly. Stream processing for logs to metrics and more.
- Advanced Embedded GUI: Intuitive and user-friendly interface.
- SQL and PromQL Support: Query logs and traces with SQL, and metrics with SQL and PromQL.
- Single Binary or HA Installation: Install using a single binary for small deployments or in HA mode for large deployments.
- Versatile Storage Options: Supports local disk, S3, MinIO, GCS, Azure Blob Storage.
- High Availability and Clustering: Ensures reliable and scalable performance.
- Dynamic Schema: Adapts to your data structure seamlessly.
- Built-in Authentication: Secure and ready to use.
- Ease of Operation: Designed for simplicity and efficiency.
- Seamless Upgrades: Hassle-free updates.
- Multilingual UI: Supports 11 languages, including English, Spanish, German, French, Chinese, and more.
For a full list of features, check thedocumentation.
docker run -d \ --name openobserve \ -v$PWD/data:/data \ -p 5080:5080 \ -e ZO_ROOT_USER_EMAIL="root@example.com" \ -e ZO_ROOT_USER_PASSWORD="Complexpass#123" \ public.ecr.aws/zinclabs/openobserve:latest
services:openobserve:image:public.ecr.aws/zinclabs/openobserve:latestrestart:unless-stoppedenvironment:ZO_ROOT_USER_EMAIL:"root@example.com"ZO_ROOT_USER_PASSWORD:"Complexpass#123"ports: -"5080:5080"volumes: -data:/datavolumes:data:
For other ways to quickly install OpenObserve or use OpenObserve cloud, checkquickstart documentation.
For installing OpenObserve in HA mode, checkHA deployment documentation.
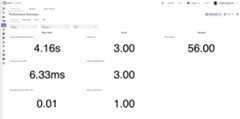
Golden metrics based on traces
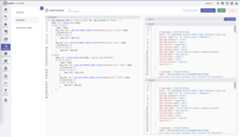
RBAC (Role Based Access Control)
Software Bill of Materials for OpenObserve
SBOM can be foundhere. You can analyze it usingdependency track.
In order to generate the SBOM, you can use the following commands:
Install cargo-cyclonedx:
cargo install cargo-cyclonedx
Generate the SBOM:
cargo-cyclonedx cyclonedx
SBOM can be foundhere. You can analyze it usingdependency track.
In order to generate the SBOM, you can use the following commands:
Install cyclonedx-npm:
npm install --global @cyclonedx/cyclonedx-npm
Generate the SBOM:
cd webcyclonedx-npm> sbom.json
OpenObserve is licensed under the AGPL-3.0 license. For more details, see theLICENSE.
Easiest way to get support is to join theSlack channel.
About
🚀 10x easier, 🚀 140x lower storage cost, 🚀 high performance, 🚀 petabyte scale - Elasticsearch/Splunk/Datadog alternative for 🚀 (logs, metrics, traces, RUM, Error tracking, Session replay).
Topics
Resources
License
Uh oh!
There was an error while loading.Please reload this page.
Stars
Watchers
Forks
Packages0
Uh oh!
There was an error while loading.Please reload this page.


