Uh oh!
There was an error while loading.Please reload this page.
- Notifications
You must be signed in to change notification settings - Fork8.1k
ENH: Add pan and zoom toolbar handling to 3D Axes#22614
New issue
Have a question about this project? Sign up for a free GitHub account to open an issue and contact its maintainers and the community.
By clicking “Sign up for GitHub”, you agree to ourterms of service andprivacy statement. We’ll occasionally send you account related emails.
Already on GitHub?Sign in to your account
Conversation
Uh oh!
There was an error while loading.Please reload this page.
1) This moves the pan logic that was already in the mouse move handlerinto the "drag_pan" method to make it available from the toolbar.2) This expands upon the panning logic to enable a zoom-to-box feature.The zoom-to-box is done relative to the Axes, so it shrinks/expandsthe box as a fraction of each delta, from lower-left Axes to lower-leftzoom-box. Thus, it tries to handle non-centered zooms, which adds morecases to handle versus the current right-click zoom only scaling fromthe center of the projection.
scottshambaugh commentedJul 11, 2022
greglucas commentedJul 11, 2022
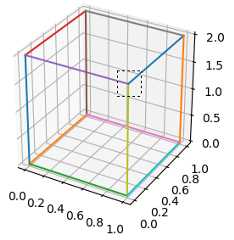
@scottshambaugh, I think this is likely due to selecting x/y/z coordinates from the 2d-x'y' plane and setting the limits based on those. (i.e. where in depth do those coordinates come from and what depth do we want to use to set the x/y/z limits for the axes?) I agree with you, this is not super ideal as it is currently. Maybe we should just remove the zoom box capability and leave it at pan which I think works better in these cases. This was a rough attempt a while ago, so I don't have a lot of interest in pushing it through right now. Please feel free to take this over if you have the time/desire! |
timhoffm commentedJul 12, 2022
@scottshambaugh Thanks for testing this PR! |
deeleeramone commentedJul 17, 2022
scottshambaugh commentedJul 17, 2022
I’m taking a stab at this, more to come soon. |
deeleeramone commentedJul 17, 2022 via email
I’ve got an icy-cold beer with your name on it if you can get those hoverable-crosshairs snapping to grid!<3 … On Jul 16, 2022, at 8:52 PM, Scott Shambaugh ***@***.***> wrote: I’m taking a stab at this, more to come soon. — Reply to this email directly, view it on GitHub <#22614 (comment)>, or unsubscribe <https://github.com/notifications/unsubscribe-auth/AUOMPBTDMZSFS2G4KA5QTP3VUN7ONANCNFSM5QBXWHXA>. You are receiving this because you commented. |
greglucas commentedJul 29, 2022 • edited
Loading Uh oh!
There was an error while loading.Please reload this page.
edited
Uh oh!
There was an error while loading.Please reload this page.
superseded by#23449 |


PR Summary
This enables the toolbar buttons to work with 3D axes now. The panning works pretty seamlessly, but the zooming is perhaps not the easiest to use still. This is because it is zooming based on relative locations between the selected box and the Axes, but the Axes actually expands beyond the corners seen in the 3D grid world. If you zoom using the x/y keys to constrain the axes, you will see that the zoom box actually goes a ways outside the 3D world, and then behaves quite well when constrained like that from an intuitive sense. I'm open to suggestions here if anyone can think of a better way to implement the zoom logic, or if we think it is still a bit too complicated and that tool should not be implemented at all.
Test with any of the 3D examples:
https://matplotlib.org/stable/gallery/mplot3d/surface3d.html
https://matplotlib.org/stable/gallery/mplot3d/scatter3d.html
Commit summary:
Closes#110
PR Checklist
Tests and Styling
pytestpasses).flake8-docstringsand runflake8 --docstring-convention=all).Documentation
doc/users/next_whats_new/(follow instructions in README.rst there).doc/api/next_api_changes/(follow instructions in README.rst there).