Uh oh!
There was an error while loading.Please reload this page.
- Notifications
You must be signed in to change notification settings - Fork8.1k
fixing 3d ticks direction#22517
New issue
Have a question about this project? Sign up for a free GitHub account to open an issue and contact its maintainers and the community.
By clicking “Sign up for GitHub”, you agree to ourterms of service andprivacy statement. We’ll occasionally send you account related emails.
Already on GitHub?Sign in to your account
Uh oh!
There was an error while loading.Please reload this page.
Conversation
ghost commentedFeb 21, 2022
it seems some image comparisons tests fail. this is most likely because before it was 'inout' displayed even though default is 'out'? That would be my guess. |
Uh oh!
There was an error while loading.Please reload this page.
ghost commentedFeb 24, 2022
I looked at the failing tests - and it seems all of them are the "out" default, which was before "inout" as it was done incorrectly. So the fix seems to be correct.
|


Uh oh!
There was an error while loading.Please reload this page.
timhoffm commentedFeb 24, 2022
Thanks, making this configurable is good. I think the previous state was just hard-coded to an 'in-out' solution and ignoring the tick params settings. There's a bit of trouble with the defaults: On 2D we have classes There are several ways one could go forward, however I think the following is the best for now: Advantages:
Disadvantages:
I have not looked into the details how the 3D tick default direction could be patched, but assume that it can be done by a few lines of code. |
ghost commentedFeb 25, 2022
@timhoffm, so you want me to add code, which will be removed anyway just to postpone fixing the tests? I can't say I see any advantages in that, just disadvantages. |
timhoffm commentedFeb 26, 2022
The suggestions is not motivated by the tests. This is about user-facing behavior and API. Before the tick direction was hard-coded. If we now do nothing special, the default tick direction would be determined by
In summary, as soon as we start using rcParams for 3D, we are getting undesired API/behavior in the intermediate solutions. Only if we fully implement 3a or 3b, we get back to a reasonable API. But that's requires quite a bit internal restructuring, and we would need to decide whether 3a or 3b is the desired solution. IHMO this is beyond the scope of this PR and could significantly delay the adoption of this PR. |
ghost commentedFeb 26, 2022
Thank you for explanations Tim. Yes, indeed it seems there is much more work on this. I just wanted to add ability to do the ticks 'in' as sometimes they went out and got too close to text and it made it look a bit weird - not acceptable for publication. By adding ability setting ticks 'in', it would resolve a lot of headaches in the future. |
oscargus commentedMar 2, 2022 • edited
Loading Uh oh!
There was an error while loading.Please reload this page.
edited
Uh oh!
There was an error while loading.Please reload this page.
I may be late on the ball here and not following all the discussions properly, but wouldn't it make sense tonot change the test images, but to use the same styles for them? And then add one image, like the one in the opening post of this PR to prove the functionality? This is from the aspect of saving repository space by not updating test images unless absolutely necessary. (Being able to configure it is 👍🏻 ) |
ghost commentedMar 2, 2022
Well, quite frankly I am bit lost here.
|
timhoffm commentedMar 3, 2022 • edited
Loading Uh oh!
There was an error while loading.Please reload this page.
edited
Uh oh!
There was an error while loading.Please reload this page.
ghost commentedMar 3, 2022 • edited by ghost
Loading Uh oh!
There was an error while loading.Please reload this page.
edited by ghost
Uh oh!
There was an error while loading.Please reload this page.
Hah. No. I just realized that it takes shorter time to write my own libraries than checking in three and half lines of code fix into matplotlib: as i am currently considering switching languages anyway: I guess i will be most likely using other library in future for displaying graphs anyway (maybe rust?). |
ghost commentedMar 3, 2022
Sorry that I wasn't more helpful. You guys can take the code and check it in if you know how to do it properly. I obviously didn't. |
WeatherGod commentedMar 3, 2022 via email
Well, you will still get credit for your contribution, we'll just have tofigure out the rest. We are thankful for submitting even this much.As for performance, just letting you know that your choice of language fordata processing can be independent of your choice of language for plotting.I often generate data in very fast languages like C++ or Fortran, save themout as netcdfs, and then can quickly plot the data using matplotlib andxarray in python. And if you want to use that link as a guide for languageperformance (dictionary performance is just one metric of many toconsider), then you'd be happy to know that matplotlib and numpy can workwith PyPy.Ultimately, matplotlib's position is that we just want users to make goodplots from their data, regardless of the library you use. So happy plotting! …On Wed, Mar 2, 2022 at 7:37 PM Peter Taraba ***@***.***> wrote: Sorry that I wasn't more helpful. You guys can take the code and check it in if you know how to do it properly. I obviously didn't. — Reply to this email directly, view it on GitHub <#22517 (comment)>, or unsubscribe <https://github.com/notifications/unsubscribe-auth/AACHF6B4T7DSPQFRXQBSJRDU6ACTDANCNFSM5O5D4NMQ> . Triage notifications on the go with GitHub Mobile for iOS <https://apps.apple.com/app/apple-store/id1477376905?ct=notification-email&mt=8&pt=524675> or Android <https://play.google.com/store/apps/details?id=com.github.android&referrer=utm_campaign%3Dnotification-email%26utm_medium%3Demail%26utm_source%3Dgithub>. You are receiving this because you are subscribed to this thread.Message ID: ***@***.***> |
ghost commentedMar 3, 2022
Thanks :) - as I said - I wished I was more helpful. I understand that matplotlib is going through a lot of changes (I actually looked at a lot of code) and I saw you guys are trying to figure the best ways (which is often hard on a moving train). I just felt I am going to slow you down :). And yes, matplotlib can be used with other languages as well. Happy plotting (I will still be using matplotlib a lot in future). |
timhoffm commentedMar 3, 2022
Will try to pick this up after#22587 is in. |
ghost commentedMar 26, 2022
Just FYI - matplotlib's 3D graphs got into my latest publications: So Thank you for all the hard work to make them look pretty! |
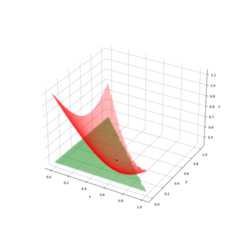
fixing 3d tick:
#21729
seems to be working:
ax.set_xlabel(r"$x$")
ax.set_ylabel(r"$y$")
ax.set_zlabel(r"$z$")
ax.tick_params(axis='x', which='major', direction='inout')
ax.tick_params(axis='y', which='major', direction='in')
ax.tick_params(axis='z', which='major', direction='out')