Uh oh!
There was an error while loading.Please reload this page.
- Notifications
You must be signed in to change notification settings - Fork8.1k
Improve autoscaling for high order Bezier curves#19214
New issue
Have a question about this project? Sign up for a free GitHub account to open an issue and contact its maintainers and the community.
By clicking “Sign up for GitHub”, you agree to ourterms of service andprivacy statement. We’ll occasionally send you account related emails.
Already on GitHub?Sign in to your account
Uh oh!
There was an error while loading.Please reload this page.
Conversation
anntzer commentedJan 1, 2021
I haven't looked in depth into this, but why did#16832 (which fixed#7184) not fix this? attn@brunobeltran perhaps? |
dstansby commentedJan 2, 2021
It looks like#16832 fixed |
QuLogic commentedJan 8, 2021
So you're trying to replace individual points by the extent corners only? How does this affect log scales? Because the fix in#18642 was to not do that as much. |
dstansby commentedJan 10, 2021
Log scaling seems fine; the failing examples seem to be mainly pie charts. Most of the changes look reasonable, but there's a couple that definitely were better before this patch, so I need to do a bit more investigating. |
dstansby commentedJan 15, 2021
😆 it turns out that log scaling wasn't quite fine. I think I've fixed it this time, but will see how the tests go. |
a105bba to0482fffComparedstansby commentedOct 8, 2021
This is now good to go, and was a pretty small change (in terms of lines of code) in the end. |
jklymak commentedNov 8, 2021
ping for a second review on this! |
 QuLogic left a comment
There was a problem hiding this comment.
Choose a reason for hiding this comment
The reason will be displayed to describe this comment to others.Learn more.
The change inlib/matplotlib/tests/baseline_images/test_axes/pie_frame_grid.png does not seem better?
Uh oh!
There was an error while loading.Please reload this page.
Uh oh!
There was an error while loading.Please reload this page.
| iflen(vertices): | ||
| vertices=np.row_stack(vertices) |
There was a problem hiding this comment.
Choose a reason for hiding this comment
The reason will be displayed to describe this comment to others.Learn more.
Do you not want to return here if empty any more?
There was a problem hiding this comment.
Choose a reason for hiding this comment
The reason will be displayed to describe this comment to others.Learn more.
Perhaps? It's a private helper function and doesn't seem to break anything though - I guess we're always passing in input that has some vertices.
There was a problem hiding this comment.
Choose a reason for hiding this comment
The reason will be displayed to describe this comment to others.Learn more.
That's becausetransform andupdate_datalim are safe to empty lists. I think this is more of an optimization to avoid decomposing the transform, etc.
jklymak commentedNov 29, 2021
@dstansby popping to draft until you can address review comments, but feel free to pop back on the queue! |
dstansby commentedNov 29, 2021
I think this is because the (0, 0) point is sticky, and is now being snapped into view. |
QuLogic commentedNov 29, 2021
I don't understand how that happens? |
dstansby commentedNov 30, 2021
My suspicion is that this PR has uncovered another bug somewhere in (auto)scaling - I'll try and work out what's going on and report back. |
dstansby commentedDec 28, 2021
I'm going to leave a trail of crumbs as I investigate the funny axes scaling. The issue only seems to appear with importmatplotlib.pyplotaspltplt.style.use('classic')# The slices will be ordered and plotted counter-clockwise.labels='Frogs','Hogs','Dogs','Logs'sizes= [15,30,45,10]colors= ['yellowgreen','gold','lightskyblue','lightcoral']# only "explode" the 2nd slice (i.e. 'Hogs')explode= (0,0.1,0,0)plt.pie(sizes,explode=explode,labels=labels,colors=colors,autopct='%1.1f%%',startangle=90,wedgeprops={'linewidth':0},frame=True,center=(2,2))# Set aspect ratio to be equal so that pie is drawn as a circle.plt.axis('equal')plt.show() |

dstansby commentedDec 28, 2021
It seems that autoscaling doesn't ever take into account the labels added by As such, I'd advocate for merging this to solve the Bezier scaling issue, and track the issues with |
jklymak commentedDec 28, 2021
That sounds reasonable. Can you fix the test so that isnot classic and we can track pie issues separately. Definitely ping if you need a review. |
dstansby commentedDec 28, 2021 • edited
Loading Uh oh!
There was an error while loading.Please reload this page.
edited
Uh oh!
There was an error while loading.Please reload this page.
👍 - I updated all the test images that are changing anyway to |
tacaswell commentedJan 26, 2022
To check my understanding the pie images are regenerated because:
If my understanding is correct@dstansby (or anyone else) can (self-)merge. |
Uh oh!
There was an error while loading.Please reload this page.
Overview
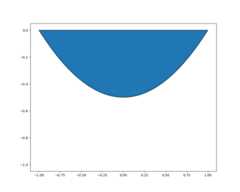
Currently every control point is used when autoscaling with a Bezier curve, but for high order curves this isn't desired, as control points that aren't the start or end point do not lie on the actual curve. A better way to calculate points for autoscaling is to include the start point, end point, and any extrema on the curve.This PR introduces a new method to convert a path from a set of Bezier segments to straight lines connecting the start, extrema, and end points. The bounding box of these points is then the bounding box of the overall Path, so it can be used for autoscaling.This leverages the new functionality in#16832 introduced to properly calculate the bounding box of a complex Bezier curve, and makes sure it is used in the autoscaling.
Fixes#19174
Example
Before:
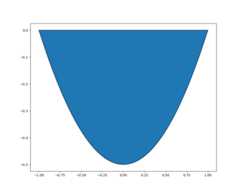
After: