Uh oh!
There was an error while loading.Please reload this page.
- Notifications
You must be signed in to change notification settings - Fork8.1k
Open
Labels
Description
Bug summary
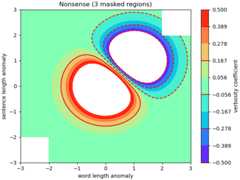
A contour plot is plotted with the minimum and maximum values of the parameter as color bar limits. Then when I try to make changes (such as limits and colormap) to the color bar from the toolbar of the generated plot it is not updating accordingly.
- A sample plot.
- Customizing the color bar.
- Options for changing the color bar.
- The changes are reflected in the color bar, but not in the plot.
Kindly suggest how I can update the plot according to the changes made in the color bar options.
Code for reproduction
# A sample code.importnumpyasnpimportmatplotlib.pyplotaspltorigin='lower'delta=0.025x=y=np.arange(-3.0,3.01,delta)X,Y=np.meshgrid(x,y)Z1=np.exp(-X**2-Y**2)Z2=np.exp(-(X-1)**2- (Y-1)**2)Z= (Z1-Z2)*2nr,nc=Z.shape# put NaNs in one corner:Z[-nr//6:,-nc//6:]=np.nan# contourf will convert these to maskedZ=np.ma.array(Z)# mask another corner:Z[:nr//6, :nc//6]=np.ma.masked# mask a circle in the middle:interior=np.sqrt(X**2+Y**2)<0.5Z[interior]=np.ma.maskedfig1,ax2=plt.subplots(constrained_layout=True)CS=ax2.contourf(X,Y,Z,10,cmap=plt.cm.bone,origin=origin)# Note that in the following, we explicitly pass in a subset of the contour# levels used for the filled contours. Alternatively, we could pass in# additional levels to provide extra resolution, or leave out the *levels*# keyword argument to use all of the original levels.CS2=ax2.contour(CS,levels=CS.levels[::2],colors='r',origin=origin)ax2.set_title('Nonsense (3 masked regions)')ax2.set_xlabel('word length anomaly')ax2.set_ylabel('sentence length anomaly')# Make a colorbar for the ContourSet returned by the contourf call.cbar=fig1.colorbar(CS)cbar.ax.set_ylabel('verbosity coefficient')# Add the contour line levels to the colorbarcbar.add_lines(CS2)plt.show()
Actual outcome
Expected outcome
The following changes have been made to the code in order to get the expected plot.lev = np.linspace(-0.5, 0.5, 10)CS = ax2.contourf(X, Y, Z, 10, cmap=plt.cm.rainbow, origin=origin, levels=lev)
Additional information
No response
Operating system
Windows
Matplotlib Version
3.4.3
Matplotlib Backend
Qt5Agg
Python version
Python 3.8.12
Jupyter version
No response
Installation
pip
