Uh oh!
There was an error while loading.Please reload this page.
- Notifications
You must be signed in to change notification settings - Fork8.1k
[Sprint] scatter plots are (reportedly) too slow#2156
New issue
Have a question about this project? Sign up for a free GitHub account to open an issue and contact its maintainers and the community.
By clicking “Sign up for GitHub”, you agree to ourterms of service andprivacy statement. We’ll occasionally send you account related emails.
Already on GitHub?Sign in to your account
Uh oh!
There was an error while loading.Please reload this page.
Conversation
ChrisBeaumont commentedJun 26, 2013
This is essentially the issue discussedhere -- calling It would begreat if matplotlib had some way of mapping size and/or color to data, without sacrificing all of that speed! I have to think there is some middle ground between the speed of |
WeatherGod commentedJun 27, 2013
Last year, john Hunter explained that he did work to optimize line Ben
|
mdboom commentedJul 22, 2013
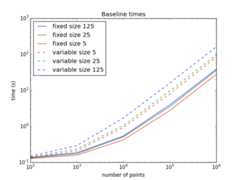
@ChrisBeaumont: I've attached some low-hanging optimizations to scatter. I've benchmarked this using points of different sizes (5, 25, 125 pixel diameters) and different numbers of points (100, 1000, 10000, 100000 and 1000000). Here's the baseline timings: Greater than linear growth -- probably mostly due to memory/cache pressures with the greater number of points. Here's the relative speedups with this patch. Three separate optimizations were found:
Beyond this, I haven't found much other low-hanging fruit that doesn't involve changing the output. I'll save that report for another issue. |


mdboom commentedJul 22, 2013
The benchmark, FYI. @ChrisBeaumont: I'd appreciate some testing in the context of the kind of data you're seeing, just to see how it compares to this completely random and synthetic benchmark. |
There was a problem hiding this comment.
Choose a reason for hiding this comment
The reason will be displayed to describe this comment to others.Learn more.
Just curious, what is the purpose of the clipping change in _backend_agg.cpp? Was that a bug?
There was a problem hiding this comment.
Choose a reason for hiding this comment
The reason will be displayed to describe this comment to others.Learn more.
Yep. It was a bug where it would avoid drawing some legitimate things.
ChrisBeaumont commentedJul 22, 2013
Nice! I'll play around with this. |
ChrisBeaumont commentedJul 22, 2013
My benchmarks are similar: before this PR: And after (note the different yaxis scaling): The comparison with Unfortunately, the biggest speedup in this PR (the blitting) essentially replicates what
Sometimes the number of combinations of colors/sizes/markers will be small, especially if they are discretized first. In these situations, scatter would benefit from caching the markers, and using the same blitting trick in draw_markers. Do you think either is feasible? I could take a crack at them in a new PR, to earn my matplotlib/C++ merit badge |


mdboom commentedJul 22, 2013
I think handling multiple colors in draw_markers should be possible. It probably requires implementing a custom blender for agg, though. Sounds, um, magical. As for caching markers based on multiple sizes, that should also be possible. I had experimented with generating one stamp and then resampling it to different sizes, but, even with low-quality nearest neighbor resampling, doesn't gain much over just rendering the vector object directly. But if you built a discrete number of sizes and used those, that should help, I suspect. We probably want some sort of option to scatter where one specifies a number of "bins" to sort the sizes into (or maybe have an "auto" option that would do something smarter). And maybe not do anything special when the number of points is small, since it will add some preprocessing overhead. |
dpsanders commentedJul 24, 2013
Looks really nice! |
ChrisBeaumont commentedJul 24, 2013
Anything with curvature in a log-log plot is definitely super-linear :) |
dpsanders commentedJul 24, 2013
True, but even with curvature it might have not have reached linear yet by On Wed, Jul 24, 2013 at 8:28 AM, Chris Beaumontnotifications@github.comwrote:
Dr. David P. Sanders Profesor Titular "A" / Associate Professor dpsanders@gmail.com Cubículo / office:#414, 4o. piso del Depto. de Física Tel.: +52 55 5622 4965 |
… list of Transform objects.When the collection has the same styling and only varies by offsets, use draw_markers instead.
mdboom commentedSep 30, 2013
I know@ChrisBeaumont wanted to take this even further, but I wonder if there's any objections to merging this as-is (since it appears to be an improvement on all fronts anyway, even if it doesn't go as far as it could). |
ChrisBeaumont commentedSep 30, 2013
+1 on merging. I do still want to push on this more, but am mired in thesis work for the next month. In any event, that can happen in a new PR |
[Sprint] scatter plots are (reportedly) too slow
@ChrisBeaumont reported in his great SciPy talk that scatter plots are too slow. We should get to the bottom of that 😉.