Uh oh!
There was an error while loading.Please reload this page.
- Notifications
You must be signed in to change notification settings - Fork8.1k
Open
Description
Bug summary
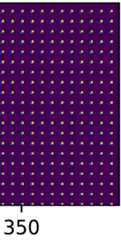
When using Axes.imshow(), images are scaled to integer pixel size (_ImageBase._make_image). This makes images notably too large when using vector graphics output, misaligning them with tick marks and plotted lines.
Code for reproduction
importnumpyasnpimportmatplotlibasmplimportmatplotlib.pyplotaspltimg=np.zeros((100,400))img[::5, ::5]=1idx=np.indices(img.shape)idx= [idx[0][::5].flatten(),idx[1][:, ::5].flatten()]fig,ax=plt.subplots(constrained_layout=True)ax.imshow(img,interpolation="None",origin="lower")ax.scatter(idx[1],idx[0],marker="x",lw=0.2,s=1)fig.savefig("imshow.pdf")
Actual outcome
The image does not align with plot markers, tick marks. Towards the top-right corner, they are even placed in adjacent pixels.
Full PDF output
Expected outcome
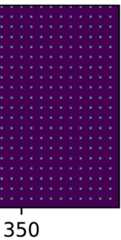
This can be worked around by calling_ImageBase._make_image withround_to_pixel_border=False:
classNotRoundedAxesImage(mpl.image.AxesImage):"""AxesImage subclass which does not round image extents to fit frame This rounding leads to improper alignment between data and image """defmake_image(self,renderer,magnification=1.0,unsampled=False):# docstring inheritedtrans=self.get_transform()# image is created in the canvas coordinate.x1,x2,y1,y2=self.get_extent()bbox=mpl.transforms.Bbox(np.array([[x1,y1], [x2,y2]]))transformed_bbox=mpl.transforms.TransformedBbox(bbox,trans)clip= ((self.get_clip_box()orself.axes.bbox)ifself.get_clip_on()elseself.figure.bbox)# Turn off round_to_pixel_border!returnself._make_image(self._A,bbox,transformed_bbox,clip,magnification,unsampled=unsampled,round_to_pixel_border=False)fig,ax=plt.subplots(constrained_layout=True)# Replicate Axes.imshowax.set_aspect(mpl.rcParams["image.aspect"])ai=NotRoundedAxesImage(ax,interpolation="none")ai.set_data(img)ai.set_extent(ai.get_extent())ax.add_image(ai)ax.scatter(idx[1],idx[0],marker="x",lw=0.2,s=1)fig.savefig("custom_image.pdf")
Operating system
Ubuntu 20.04
Matplotlib Version
3.4.3
Matplotlib Backend
PDF, SVG, PGF, probably others
Python version
3.7
Jupyter version
No response
Other libraries
No response
Installation
conda
Conda channel
conda-forge
