Uh oh!
There was an error while loading.Please reload this page.
- Notifications
You must be signed in to change notification settings - Fork8.1k
Closed
Milestone
Description
Bug report
Bug summary
#16258 deprecatesshading="flat" when data and coordinates have the same shape and introducesshading="nearest" which interpolates the coordinates. However, the logic to interpolate the coordinates breaks down if they are not monotonically increasing.
matplotlib/lib/matplotlib/axes/_axes.py
Line 5684 in8511771
| def_interp_grid(X): |
Of course non-monotonic coordinates are a bit exotic but they make sense for geographic data.
Code for reproduction
importnumpyasnpdef_interp_grid(X):# helper for belowifnp.shape(X)[1]>1:dX=np.diff(X,axis=1)/2.X=np.hstack((X[:, [0]]-dX[:, [0]],X[:, :-1]+dX,X[:, [-1]]+dX[:, [-1]]))returnXx=np.array([1,2,0])y=np.array([1,2])X,Y=np.meshgrid(x,y)_interp_grid(X)
Actual outcome
Results in
array([[0.5,1.5,1. ,-1. ], [0.5,1.5,1. ,-1. ]])
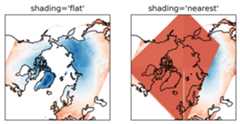
While having cooridinates[1, 2, 0] may seem just as wrong as coordinates[0.5, 1.5, 1, -1] the latter can cause some real-world problems in conjunction with cartopy (SciTools/cartopy#1638):
Expected outcome
- A warning for non-monotonic data
- A convenient option to restore the old behaviour, e.g.
shading="drop"
Matplotlib version
- Operating system: Linux Mint
- Matplotlib version: '3.3.1'
- Matplotlib backend (
print(matplotlib.get_backend())): TkAgg - Python version: 3.8
- Jupyter version (if applicable):
- Other libraries:
