- Notifications
You must be signed in to change notification settings - Fork5
APM for NodeJS using Prometheus
License
last9/openapm-nodejs
Folders and files
| Name | Name | Last commit message | Last commit date | |
|---|---|---|---|---|
Repository files navigation
An APM solution based on metrics and open-source tools such as Prometheus and Grafana for NodeJs-based applications.
npm install --save @last9/openapm@latestconstexpress=require('express');const{ OpenAPM}=require('@last9/openapm');constapp=express();constopenapm=newOpenAPM();// Instrument servicesapp.listen(3000);constgracefullyShutdown=()=>{app.close(()=>{openapm.shutdown().then(()=>{console.log('OpenAPM shutdown successful.');}).catch((err)=>{console.log('Error shutting down OpenAPM',err);});});};process.on('SIGINT',gracefullyShutdown);process.on('SIGTERM',gracefullyShutdown);
In the example below, the metrics will be served onlocalhost:9097/metrics. Tochange the port, you can update it through the options(See the options documentation).
const{ OpenAPM}=require('@last9/openapm');constopenapm=newOpenAPM();openapm.instrument('express');
This currently supports instrumentation for all Node.js ORMs, which aremysql2 compatible.
Ensure to add this line of code before you initialize dbconnection/pool/poolCluster.
openapm.instrument('mysql');
OpenAPM currently supports RED Metrics for NestJS v4 and above.
openapm.instrument('nestjs');
OpenAPM supports RED metrics for both pages and app router in a Next.js application.
openapm.instrument('nextjs');
Note: You can only use the library if Next.js runs in a Node.js environment. Since OpenAPM relies on prom-client for capturing metrics data, a serverless environment might not be able persist them.
constopenapm=newOpenAPM({// Options go here});
path: The path at which the metrics will be served. For eg./metricsmetricsServerPort: (Optional) The port at which the metricsServer will run.environment: (Optional) The application environment. Defaults toproduction.defaultLabels: (Optional) Any default labels to be included.requestsCounterConfig: (Optional) Requests counter configuration, same asCounter inprom-client.Defaults to{name:'http_requests_total',help:'Total number of requests',labelNames:['path','method','status'],}
requestDurationHistogramConfig: (Optional) Requests Duration histogramconfiguration, the same asHistogram inprom-client. Defaults to{name:'http_requests_duration_milliseconds',help:'Duration of HTTP requests in milliseconds',labelNames:['path','method','status'],buckets:promClient.exponentialBuckets(0.25,1.5,31),}
extractLabels: (Optional) Extract labels from URL params (WIP: Headers, Subdomain)// To extract from the URL params{ ...extractLabels:{tenant:{// Here 'tenant' is the label namefrom :'params',key:'org'// Which key to extract from the paramsmask:':org'// Replacement string}}}
excludeDefaultLabels: (Optional) Provide labels to exclude from the default labels
{ ...excludeDefaultLabels:['environment','version']}
levitateConfig: (Optional) Configuration for Levitate TSDB. Adding this configuration will enable theChange Events.enableMetricsServer: (Optional) Defaults totrue. When set tofalsethe OpenAPM won't start a metrics server. To get the metrics users can rely on the.getMetrics()function.
{ ...levitateConfig:{host:'https://app.last9.io',orgSlug:'last9',/** The slug can be obtained from the Last9 dashboard.*/dataSourceName:'data-source',/** The data source can be obtained from the data source pages in the Last9 dashboard*/refreshTokens:{write:'0d2a1a9a45XXXXXXXXXXXXXX3f1342790d2a1a9a45XXXXXXXXXXXXXX3f1342790d2a1a9a45XXXXXXXXXXXXXX3f134279'/** You can get this from the API access page on Last9 dashboard*/}}}
enabled: (Optional) Defaults totrue. When set tofalseOpenAPM will be disabled and no metrics will be collected or emitted.
const openapm = new OpenAPM({ enabled: process.env.NODE_ENV === 'production'})additionalLabels: (Optional) Accepts an array of label keys that will be emitted with the metrics. This option is used in tandem with thesetOpenAPMLabelsAPI. CheckoutAPI Reference
const openapm = new OpenAPM({ additionalLabels: ['slug']})instrument: Used to instrument supported technologies. Refer theusage section.getMetrics: Returns a Promise of string which contains metrics in Prometheus exposition format. You can use this function to expose a metrics endpoint ifenableMetricsServeris set to false. For example,
constopenapm=newOpenAPM({enableMetricsServer:false});openapm.instrument('express');constapp=express();app.get('/metrics',async(_,res)=>{constmetrics=awaitopenapm.getMetrics();res.setHeader('Content-Type','text/plain; version=0.0.4; charset=utf-8');res.end(metrics);});
shutdown: Returns a promise which is resolved after the cleanup in OpenAPM. The cleanup includes closing the metrics server if it has started and cleared the prom-client register.
constgracefullyShutdown=()=>{server.close(()=>{openapm.shutdown().then(()=>{console.log('OpenAPM shutdown successful.');}).catch((err)=>{console.log('Error shutting down OpenAPM',err);});});};process.on('SIGINT',gracefullyShutdown);process.on('SIGTERM',gracefullyShutdown);
setOpenAPMLabels: Unlike other APIs. You can directly importsetOpenAPMLabelsin any file to set custom labels to the request. Make sure to mention the label key inadditionalLabelsoption. This function can set multiple labels in the metrics emitted by the ongoing HTTP request.
Note:setOpenAPMLabels currently works withexpress andNest.js only.
import{OpenAPM,setOpenAPMLabels}from'@last9/openapm';constopenapm=newOpenAPM({additionalLabels:['slug']});consthandler=()=>{setOpenAPMLabels({slug:'org-slug'});};
- Defining custom metrics
OpenAPM exposes underlyingprom-client viagetMetricClient function.
const{ getMetricClient}=require('@last9/openapm');// initialize custom metricconstclient=getMetricClient();constcounter=newclient.Counter({name:'cancelation_calls',help:'no. of times cancel operation is called'});// handlerapp.get('/cancel/:ids',(req,res)=>{counter.inc();res.status(200).json({});});
Follow thedocumentation of prom-clientto get familiar with the DSL for defining custom metrics.
Make sure you are in the express directory.
- Install packages
npm installBuild package
- This will build the package and store the JS and type declaration files inthe
distfolder.
- This will build the package and store the JS and type declaration files inthe
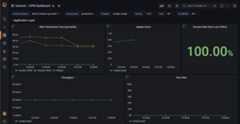
npm run build- Importthis dashboard into your Grafana
- Select your data source
- Save the dashboard
Last9 builds reliability tools for SRE and DevOps.
About
APM for NodeJS using Prometheus
Topics
Resources
License
Code of conduct
Security policy
Uh oh!
There was an error while loading.Please reload this page.
Stars
Watchers
Forks
Releases
Uh oh!
There was an error while loading.Please reload this page.
Contributors5
Uh oh!
There was an error while loading.Please reload this page.


