Movatterモバイル変換


[0]ホーム

URL:


Skip to content

Navigation Menu

Sign in
Appearance settings

Search code, repositories, users, issues, pull requests...

Provide feedback

We read every piece of feedback, and take your input very seriously.

Saved searches

Use saved searches to filter your results more quickly

Sign up
Appearance settings

Testing the performance of ray marching using different rendering spaces

NotificationsYou must be signed in to change notification settings

danliukuri/RaymarchingRenderingSpacePerformanceTesting

Repository files navigation

This project focuses on testing the performance of ray marching using different rendering spaces. All metrics are gathing using thePerformance Testing Extension package for theUnity Test Runner framework.

Rendering Spaces

Scene space rendering

Using scene space rendering during ray marching involves rendering the entire scene by processing all objects, lights, and effects within the scene.

image

Figure 1. Process of ray marching using screen rendering space
(left: ray marching in rendering space, right: technical view of rendering result)

Bounding volumes space rendering

Using bounding volumes as space rendering during ray marching involves utilizing simplified shapes (bounding volumes) to approximate the spatial extent of complex objects.

image

Figure 2. Process of ray marching using bounding volumes rendering space
(left: ray marching in rendering space, right: technical view of rendering result)

Test Scenes

Test Scene 1

Experiment scene feature a collection of 30 simple 3D sphere Signed Distance Functions (SDFs). The spheres are organized into groups of three, with smooth blending SDF Boolean operations applied within each group, utilizing Constructive Solid Geometry (CSG) techniques. The spheres are positioned closely together within each group to ensure visible blending effects.

In case of bounding volumes we opted to use a Pentakis Dodecahedron, due to its efficiency in defining an accurate sphere shape with minimal vertices and triangles.

Experiment scene

Figure 3. Experiment scene (same rendering output for both approaches)

Experiment scene heatmap (screen rendering space)

Figure 4. Experiment scene heatmap (screen rendering space)

TestScene1HeatMap_002_1920x1080_2024-03-29

Figure 5. Experiment scene heatmap (bounding volumes rendering space)

Usage Examples

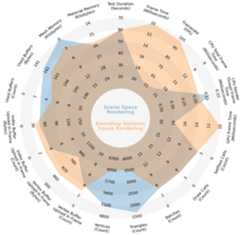
To quantify the peformance differences between two approaches and their comparison was developed acustom Python solution, resulting in a visually informative radar chart for comparative analysis. The XML files generated in this project using thePerformance Testing Extension are used as input to produce the output image in the above-mentioned solution.

The results of comparing the peformance metrics of scene space and bounding volumes space rendering techniques of ray marching for test scene 1 can be seen in Figure 6.

Rendering performance comparison radar chart

Figure 6. Rendering performance comparison radar chart
(average values calculated from data measured during 60 seconds)


[8]ページ先頭

©2009-2025 Movatter.jp