Uh oh!
There was an error while loading.Please reload this page.
- Notifications
You must be signed in to change notification settings - Fork802
A dynamically generated activity graph to show your GitHub activities of last 31 days.
License
Ashutosh00710/github-readme-activity-graph
Folders and files
| Name | Name | Last commit message | Last commit date | |
|---|---|---|---|---|
Repository files navigation


The deployment of this project is moved fromhttps://activity-graph.herokuapp.com domain tohttps://github-readme-activity-graph.cyclic.app. In casehttps://github-readme-activity-graph.cyclic.app doesn't work try withhttps://github-readme-activity-graph.vercel.app for more details, referthis
Please refer to the updated linkhere
- Table of contents
- How to Use
- Use themes
- Available Themes
- Customization
- Deploy on your own Replit instance
- Deploy on your own Vercel instance
- Contributing
- Core Team 💻
- Contributors ✨
- Resources Used to build this project
- Star History
Just paste the following URL in your profile readme and you are good to go.
Pass yourusername in the URL
[](https://github.com/ashutosh00710/github-readme-activity-graph)
username=ashutosh00710&theme=theme_name
[](https://github.com/ashutosh00710/github-readme-activity-graph)
Manual Customization is also available
| Name | Preview |
|---|---|
| Default (cotton candy) |  |
| react |  |
| react-dark |  |
| github |  |
| github-compact |  |
| xcode |  |
| rogue |  |
| merko |  |
| vue |  |
| tokyo-night |  |
| high-contrast |  |
For more themes clickhere
Customize the appearance of your Activity Graph however you want with URL params.
| Arguments | Description | Type of Value |
|---|---|---|
bg_color | card's background color | hex code (without#) |
border_color | card's border color | hex code (without#) |
color | graph card's text color | hex code (without#) |
title_color | graph card's title color | hex code (without#) |
line | graph's line color | hex code (without#) |
point | color of points on line graph | hex code (without#) |
area_color | color of the area under the graph | hex code (without#) |
area | shows area under the graph | boolean (default:false) |
hide_border | makes the border of the graph transparent | boolean (default:false) |
hide_title | sets the title to an empty string | boolean (default:false) |
custom_title | set the title to any string | string |
theme | name ofavailable themes | string |
radius | border radius of graph | number (0-16 inclusive) |
height | height of the graph | number (200-600 inclusive) |
days | number of to days display on graph | number between (1 - 90) [Recommended below 40] |
from | date from which the graph starts | formatYYYY-MM-DD |
to | date where the graph will end | formatYYYY-MM-DD |
grid | show grid | boolean (default:true) |
⚠Forcustom_title please make sure that you are using %20 for spaces
Example:
custom_title=This%20is%20a%20title
[](https://github.com/ashutosh00710/github-readme-activity-graph)
Example:
[](https://github.com/ashutosh00710/github-readme-activity-graph)
Step-by-step instructions for deploying to Replit (from UI)
- Sign in to Replit or create a new account athttps://replit.com
- Click the Deploy button below
On the page that comes up, choose language as
Node.jsand then clickImport from GitHubButton
Visitthis link to create a new Personal Access Token
Scroll to the bottom and click "Generate token"
Wait clone done and add
Secretswith yourGithub token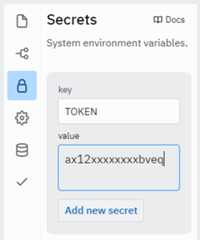
Click the green
RUNbutton on top, the console will run and at last the url will shows on the rightNow just add the following to your profile readme and you're good to go


Step-by-step instructions for deploying to Vercel (from UI)
- Go tovercel.com.
- Click on
Log in.
- Sign in with GitHub by pressing
Continue with GitHub.
- Sign in to GitHub and allow access to all repositories if prompted.
- Fork this repo.
- Go back to yourVercel dashboard.
- To import a project, click the
Add New...button and select theProjectoption.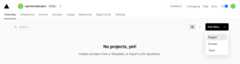
- Click the
Continue with GitHubbutton, search for the required Git Repository and import it by clicking theImportbutton.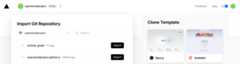
- Create a personal access token (PAT)here and enable the
repopermissions (this allows access to see private repo stats).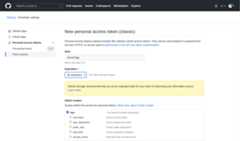
- Add the PAT as an environment variable named
TOKEN.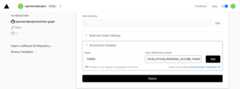
- Click deploy, and you're good to go. See your domains to use the API!


Alternatively, click the button below and follow the instructions.
After the deployment is complete:
- Click the
Continue to Dashboardbutton
- In the
Settingstab, click onEnvironment Variablesand follow steps9.and10.ofFirst Method.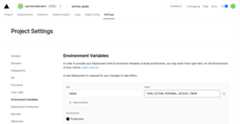
- Go to
Deploymentstab and redeploy the project.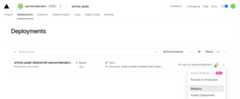


Now just add the following to your profile readme and you're good to go.

Please read through ourcontributing guidelines. Directions are included for opening issues, coding standards, and notes on development.
Ashutosh Dwivedi 📆💻📖🤔⚠ | Kshitij Srivastava 📆💻📖🎨 |
Thanks goes to these wonderful people (emoji key):
This project follows theall-contributors specification. Contributions of any kind welcome!
| Purpose | Library Name | Link |
|---|---|---|
| Graph Construction | CHARTIST.JS | https://github.com/gionkunz/chartist-js |
About
A dynamically generated activity graph to show your GitHub activities of last 31 days.
Topics
Resources
License
Code of conduct
Contributing
Uh oh!
There was an error while loading.Please reload this page.
Stars
Watchers
Forks
Sponsor this project
Uh oh!
There was an error while loading.Please reload this page.
