- Notifications
You must be signed in to change notification settings - Fork45
Get use of test results
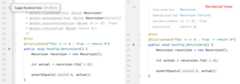
If generating summaries isenabled in UnitTestBot settings, you have the generated tests clustered into suites. Analyze these suites to see failing tests, explicitly thrown exceptions, and successful executions.
These suites are marked asregions in the test source code (see cluster comments in thepicture below). To view allthe suites atonce and navigate betweenthem, pressAlt+7 to open theStructure tool window.
The typical suites are:
- Symbolic execution engine,
- Fuzzer,
- Other
each divided into:
- Successful executions
- Explicitly thrown unchecked exceptions
- Error suite
Find the example below:

Dive into these suites to find test methods with detailed descriptions.

Each test contains:
Briefly describes a test execution path.
- SeeJavadoc comment style for configuring thePlaintext orStructured via custom Javadoc tags view.

- Render Javadoc comments to get more clear and structured view.
- Jump to the method-under-test right from the comment.
Provide a super short test method description inside:
For JUnit 5:
@DisplayName("<short description>")For TestNG:
@Test(description = "<short description>")
(For JUnit 4 there are no descriptions right in the annotations.)Disabled (or sandboxed) tests
Sometimes the tests with the@Disabled annotation and a stack trace appear in the output:
@Disabled("Disabled due to sandbox")Keep calm: it is a feature, not a bug. These tests were sandboxed, i.e. interrupted, because they tried to execute potentially unsafe code.
The most commonly forbidden actions are:
- working with files (read, write, create, delete),
- connecting to sockets,
- invoking
System.exit(), - accessing system properties or JVM properties,
- usingReflection.
You canadd permissions in
~\.utbot\sandbox.policy. Create this file manually.You can refer to theFull list of permissions.
If you are sure you want the code to be executed as is (including the unsafe operations!) you canturn sandboxing off: add
AllPermissionto~\.utbot\sandbox.policy. Be careful!If you remove the@Disabled annotation and run the test, it will be run without creating a sandbox.
Usually looks liketestMethodUnderTestName. Sometimes it is accompanied by explanatory supplements: e.g.,ByFuzzer,ReturnsOneWithCornerCase, or others.
There are multiple ways torun tests andview coverage in IntelliJ IDEA. All of them apply to UnitTestBot results — feel free to choose any.

If you are not satisfied with coverage, try toExperiment with test generation.
It is theStatic Analysis Results Interchange Format — a standard, JSON-based format for the output of static analysis tools.
Every static analysis tool has its own output format, and these formats usually have little in common. SARIF provides a universal output format, which makes it possible to create common tooling, such as viewers, bug filers, metrics calculators, etc.
For more information, please refer toSARIF Tutorials.
By default, UnitTestBot creates a SARIF report for each test generation.
Note: if you enableParameterized tests in theGenerate Tests with UnitTestBot window, SARIF report is unavailable for now.
You can find SARIF reports in theresources directory nearTest sources root.

If test generation reveals errors in your code, they are registered in the SARIF report. IntelliJ IDEAautomatically opens theProblems tool window showing the detected errors.
InProblems:
- click each error and press the buttons with a yellow light bulb toView generated test orAnalyze stack trace,
- double-click the error to navigate to a corresponding fragment in your source code.

- Check system requirements
- Install or update plugin
- Generate tests with default configuration
- Fine-tune test generation
- Get use of test results
(redirect to/docs inmain repo)
- Contributing guide
- Developer guide
- Naming and labeling conventions
- Interprocess debugging
- Interprocess logging
- UnitTestBot overall architecture
- Android Studio support
- Assumption mechanism
- Choosing language-specific IDE
- Code generation and rendering
- Fuzzing Platform (FP) Design
- Instrumented process API: handling errors and results
- UnitTestBot JavaScript plugin setup
- Night statistics monitoring
- RD for UnitTestBot
- Sandboxing
- UnitTestBot settings
- Speculative field non-nullability assumptions
- Symbolic analysis of static initializers
- Summarization module
- Taint analysis
- UnitTestBot decomposition
- UtUtils class
- UnitTestBot Family changes