- Notifications
You must be signed in to change notification settings - Fork26
Jupyter Notebook extension leveraging pandas DataFrames by integrating DataTables and ChartJS.
License
CermakM/jupyter-datatables
Folders and files
| Name | Name | Last commit message | Last commit date | |
|---|---|---|---|---|
Repository files navigation
![]()
Jupyter Notebook extension to leverage pandas DataFrames by integrating DataTables JS.
Data scientists and in fact many developers work withpd.DataFrame on daily basis to interpret data to process them. In my typical workflow. The common workflow is to display the dataframe, take a look at the data schema and then produce multiple plots to check the distribution of the data to have a clearer picture, perhaps search some data in the table, etc...
What if those distribution plots were part of the standard DataFrame and we had the ability to quickly search through the table with minimal effort? What if it was the default representation?
The jupyter-datatables usesjupyter-require to draw the table.
pip install jupyter-datatables
importnumpyasnpimportpandasaspdfromjupyter_datatablesimportinit_datatables_modeinit_datatables_mode()
That's it, your default pandas representation will now use Jupyter DataTables!
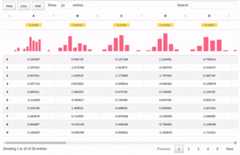
df=pd.DataFrame(np.abs(np.random.randn(50,5)),columns=list(string.ascii_uppercase[:5]))

In most cases, you don't need to worry too much about the size of your data. Jupyter DataTablescalculates required sample size based on a confidence interval (by default this would be0.95) and margin of error and ceils it to the highest 'smart' value.
For example, for a data containing100,000 samples, given0.975 confidence interval and0.02 margin of error, the Jupyter DataTables would calculate that3044 samples are required and it would round it up to4000.

With additional note:
Sample size: 4,000 out of 100,000
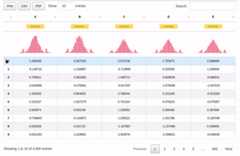
We can also handle wide tables with ease.
df=pd.DataFrame(np.abs(np.random.randn(50,20)),columns=list(string.ascii_uppercase[:20]))
As per 0.3.0, there is a support forinteractive tooltips:
And also support for custom indices includingDate type:
dft=pd.DataFrame({'A':np.random.rand(5),'B': [1,1,3,2,1],'C':'This is a very long sentence that should automatically be trimmed','D': [pd.Timestamp('20010101'),pd.Timestamp('20010102'),pd.Timestamp('20010103'),pd.Timestamp('20010104'),pd.Timestamp('20010105')],'E':pd.Series([1.0]*5).astype('float32'),'F': [False,True,False,False,True], })dft.D=dft.D.apply(pd.to_datetime)dft.set_index('D',inplace=True)

Check out theProject Board where we track issues and TODOs for our Jupyter tooling!
Author: Marek Cermakmacermak@redhat.com, @AICoE
About
Jupyter Notebook extension leveraging pandas DataFrames by integrating DataTables and ChartJS.
Topics
Resources
License
Uh oh!
There was an error while loading.Please reload this page.
Stars
Watchers
Forks
Packages0
Uh oh!
There was an error while loading.Please reload this page.