Good labels are critical for making your plots accessible to a wideraudience. Always ensure the axis and legend labels display the fullvariable name. Use the plottitle andsubtitle to explain themain findings. It's common to use thecaption to provide informationabout the data source.tag can be used for adding identification tagsto differentiate between multiple plots.
![[Superseded]](/image.pl?url=https%3a%2f%2fggplot2.tidyverse.org%2freference%2f..%2freference%2f..%2freference%2ffigures%2flifecycle-superseded.svg&f=jpg&w=240) :
:xlab(),ylab() andggtitle() aresuperseded. It is recommended to use thelabs(x, y, title, subtitle)arguments instead.
get_labs() retrieves completed labels from a plot.
Arguments
- ...
New name-value pairs. The name should be an aesthetic. The values can beone of the following:
A string or expression to set a label verbatim.
A function to use as formatter for the default label.
NULLto remove a label.A
waiver()to use the default label.
- title
The text for the title.
- subtitle
The text for the subtitle for the plot which will bedisplayed below the title.
- caption
The text for the caption which will be displayed in thebottom-right of the plot by default.
- tag
The text for the tag label which will be displayed at thetop-left of the plot by default.
- dictionary
A named character vector to serve as dictionary.Automatically derived labels, such as those based on variables willbe matched with
names(dictionary)and replaced by the matchingentry indictionary.- alt, alt_insight
Text used for the generation of alt-text for the plot.Seeget_alt_text for examples.
altcan also be a function thattakes the plot as input and returns text as output.altalso acceptsrlanglambda function notation.- label
The title of the respective axis (for
xlab()orylab()) orof the plot (forggtitle()).- plot
A ggplot object
Details
You can also set axis and legend labels in the individual scales (usingthe first argument, thename). If you're changing other scale options, thisis recommended.
If a plot already has a title, subtitle, caption, etc., and you want toremove it, you can do so by setting the respective argument toNULL. Forexample, if plotp has a subtitle, thenp + labs(subtitle = NULL) willremove the subtitle from the plot.
See also
Theplot and axis titles section of the online ggplot2 book.
Examples
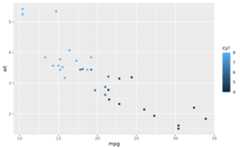
p<-ggplot(mtcars,aes(mpg,wt, colour=cyl))+geom_point()p+labs(colour="Cylinders") p+labs(x="New x label")
 # Set labels by variable name instead of aestheticp+labs(dictionary=c( disp="Displacment",# Not in use cyl="Number of cylinders", mpg="Miles per gallon", wt="Weight (1000 lbs)"))
 # The plot title appears at the top-left, with the subtitle# display in smaller text underneath itp+labs(title="New plot title")
 p+labs(title="New plot title", subtitle="A subtitle")
 # The caption appears in the bottom-right, and is often used for# sources, notes or copyrightp+labs(caption="(based on data from ...)")
 # The plot tag appears at the top-left, and is typically used# for labelling a subplot with a letter.p+labs(title="title", tag="A")
 # If you want to remove a label, set it to NULL.p+labs(title="title")+labs(title=NULL)