![[Superseded]](/image.pl?url=https%3a%2f%2fggplot2.tidyverse.org%2freference%2f..%2farticles%2f..%2freference%2ffigures%2flifecycle-superseded.svg&f=jpg&w=240) : It is recommended to pass a function tothe
: It is recommended to pass a function tothelimits argument in scales instead. For example:scale_x_continuous(limits = ~range(.x, 0)) to include zero.
Sometimes you may want to ensure limits include a single value, for allpanels or all plots. This function is a thin wrapper aroundgeom_blank() that makes it easy to add such values.
Examples
p<-ggplot(mtcars,aes(mpg,wt))+geom_point()p+expand_limits(x=0) p+expand_limits(y=c(1,9))
 p+expand_limits(x=0, y=0)
 ggplot(mtcars,aes(mpg,wt))+geom_point(aes(colour=cyl))+expand_limits(colour=seq(2,10, by=2))
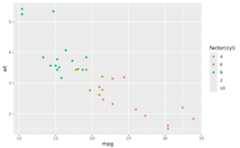
 ggplot(mtcars,aes(mpg,wt))+geom_point(aes(colour=factor(cyl)))+expand_limits(colour=factor(seq(2,10, by=2)))