Developer tools toolbox
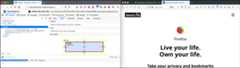
You use an implementation of the developer tools called Toolbox to debug extensions. To open Toolbox for an extension:
- enter
about:debuggingin the URL bar. - in the left-hand menu, clickThis Firefox (orThis Nightly).
- clickInspect next to your extension.
A new tab opens showingInspector in the Toolbox.

To debug your extension, you use:
- Inspector to examine and modify the HTML and CSS used to build your extension's pages.
- Console to view messages logged by the extension and error messages logged by the browser as it runs the extension. It also provides a command line, where you can execute JavaScript in the extension's context.
- Debugger to set breakpoints and watchpoints in your extension's JavaScript, and examine and modify the extension's state.
- Storage to view details of data stored by the extension.
This console shows messages from your background script and extension pages; other logs may appear elsewhere.
There is an overview of all relevant places to look for messages atViewing log output.
For much of the debugging work, it's useful to viewConsole withInspector orDebugger. You do this using thesplit console, pressesc to activate this mode.

You now drag the toolbox tab to a separate window, so you can place it alongside the window where you're executing the extension.
Viewing log output
Your extension can generate log messages, e.g., with theConsole API or by triggering (uncaught) errors.
Log messages are usually viewed in theConsole of the context where the script runs.
TheDeveloper tools toolbox atabout:debugging shows log messages from extension scripts. For specific cases, see:
- Debugging background scripts
- Debugging options pages
- Debugging popups
- Debugging sidebars
- Debugging devtools panels.
Log messages from content scripts can be viewed in the developer tools of the tab where the content script runs instead ofabout:debugging, see:
Log messages not associated with an extension script, such as thestderr output of thenativeMessaging API can only be viewed in the Browser Console. This console contains messages from the whole browser, including your and other extensions. It occasionally contains more detailed information about errors reported to your extension. For more information, see:
Debugging background scripts
We use thenotify-link-clicks-i18n extension example to illustrate the debugging features relevant to background scripts. This example is in thewebextensions-examples repository.
Background scripts enable an extension to monitor and react to events in the browser, such as navigating to a new page, removing a bookmark, or closing a tab. These scripts can be persistent or non-persistent. Persistent background scripts remain loaded for the lifetime of the extension. In contrast, non-persistent background scripts load when needed to respond to an event and unloaded when they become idle. Non-persistent background scripts are recommended because they consume less of the browser's resources.
Background scripts are loaded inside an invisible background page: by default, this is an empty HTML document, but you can specify a custom page and define it as the background page using themanifest.jsonbackground key.
To debug background scripts, use theToolboxDebugger in thesplit console view so you can view theConsole belowDebugger.
To get started, open your background script inSources.
As you run your extension, theConsole displays logged output, including calls toconsole.log() made by the extension's background scripts and any errors the browser raises as it executes these scripts. Note that the console shows all errors raised by the browser, not just errors related to your extension's code.
When you debug a non-persistent background script, the background script won't go idle while the toolbox is open. However, if you need to terminate the background page, you can do so inabout:debugging.
For example, thenotify-link-clicks-i18n example extension logs a message from its background script when it receives a message from one of its content scripts.

Using theConsole command line, you can access and modify the objects created by your background scripts. For example, you can call thenotify() function:

In theDebugger you can set breakpoints, step through code, modify the extension's state, and doeverything else you'd expect to be able to do in a debugger.
For more information about using the debugger, see theDebugger guide.
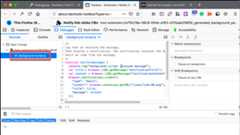
Debugging options pages
We use thefavourite-colour extension example to illustrate the debugging features relevant to options pages. This example is in thewebextensions-examples repository.
Anoptions pages is an HTML page shown when the user accesses your extension's preferences in Add-ons Manager, either by opening Add-ons Manager themselves or using a link provided in your extension. You use an options page to enable the user to set and save options and settings that affect the behavior of your extension. Options pages display in an iframe in Add-ons Manager.
To debug options pages, use theToolboxDebugger in thesplit console view so you can view theConsole belowDebugger.
To get started:
- enter
about:addonsin the URL bar, to open Add-ons Manager. - open your extension's preferences:

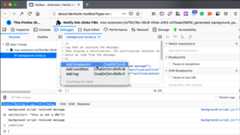
- locate the options page script in Sources.

In theDebugger you can set breakpoints, step through code, modify the extension's state, and doeverything else you'd expect to be able to do in a debugger. Any messages logged by your code display inConsole.
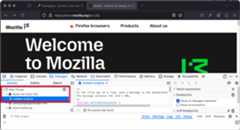
To debug the options page's HTML and CSS, point the tools at the iframe that hosts the page. To do this:
- switch toInspector.
- click the page selector (1).
- click the options page's HTML item (2).
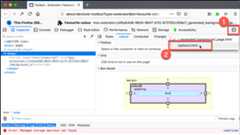
For more information about usingInspector, see theInspector guide.
Debugging popups
We use thebeastify extension example to illustrate the debugging features relevant to popups. This example is in thewebextensions-examples repository.
Popups are dialogs attached to browser or page actions. Popups are specified using an HTML document that can include CSS and JavaScript, which define styling and behavior.
To debug popups, use theToolboxDebugger in thesplit console view so you can view theConsole belowDebugger.
To debug a popup it needs to be visible (so that its HTML document is loaded). However, having opened a popup, if you click outside the popup it closes and its code unloads. This would appear to make debugging rather difficult. To overcome this challenge, in the options menu, clickDisable Popup Auto-Hide.
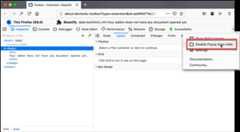
Now, when you open a popup it stays open and its code remains loaded.
Disable popup auto-hide also applies to built-in browser popups, such as the options menu. The setting doesn't persist across sessions. When you close the window, the setting reverts to auto-hide popups.
Internally, this option toggles theui.popup.disable_autohide preference, which you can toggle manually fromabout:config.
With the popup open, its JavaScript sources are listed inDebugger. In theDebugger you can set breakpoints, step through code, modify the extension's state, and doeverything else you'd expect to be able to do in a debugger. Any messages logged by your code display inConsole.

To inspect the popup's HTML and CSS, useInspector in thesplit console view so you can view theConsole belowInspector. You canreview and modify the popup's HTML and CSS inInspector, as you would with any webpage.
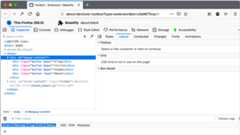
If your extension has multiple HTML documents open, click the page select icon ( ) to open the popup's document.
Debugging content scripts
We use thenotify-link-clicks-i18n extension example to illustrate the debugging features relevant to content scripts. This example is in thewebextensions-examples repository.
Acontent script is a part of your extension that runs in the context of a webpage; it enables your extension to react to events on the webpage and make changes to its content.
BecauseFirefox is multiprocess, content scripts run in a different process than other parts of an extension. Therefore, to debug content scripts, you use the developer tools for the page containing the script. To do this:
- in the Firefox menu (orTools menu if you display the menu bar or are on macOS), clickWeb Developer, thenDebugger.
- press
Ctrl + Shift + i(Command + Option + ion macOS) and clickDebugger.
If you activated thesplit console view, to view theConsole belowDebugger, the tools open in this mode. Otherwise, pressesc to activate this mode.
Content scripts may not be visible by default. If you can't see your extension and its content scripts, click the gear icon inSources and selectShow content scripts.
Now, select your content scripts inSources.
You can set breakpoints, step through code, modify the extension's state, and doeverything else you'd expect to be able to do in a debugger. Any messages logged by your code display inConsole.
If the developer tools tab was not open when the content script was injected, the content script may not be listed inSources. Reload the page with the developer tools open to show the content script.
Debugging sidebars
We use theannotate-page extension example to illustrate the debugging features relevant to sidebars. This example is in thewebextensions-examples repository.
ASidebar is a pane displayed at the side of the browser window, next to the web page. Sidebars are specified using an HTML document that can include CSS and JavaScript, which define styling and behavior.
To debug a sidebar, use theToolboxDebugger in thesplit console view so you can view theConsole belowDebugger.
To debug a sidebar, open the sidebar and locate its JavaScript inDebugger.
In theDebugger you can set breakpoints, step through code, modify the extension's state, and doeverything else you'd expect to be able to do in a debugger. Any messages logged by your code display inConsole.
To inspect the sidebar's HTML and CSS, useInspector in thesplit console view so you can view theConsole belowInspector. You canreview and modify the sidebar's HTML and CSS inInspector, as you would with any webpage.

If your extension has multiple HTML documents open, click the page select icon () to open the sidebar's document.
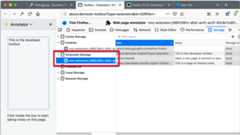
Debugging storage
We use theannotate-page extension example to illustrate the debugging features relevant to extension storage. This example is in thewebextensions-examples repository.
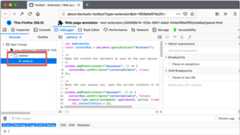
An extension can store data using theStorage API. To view this data, in theToolbox open theStorage tab and locateExtension Storage.
Debugging developer tools pages and panels
We use thedevtools-panels extension example to illustrate the debugging features relevant to developer tools pages and panels. This example is in thewebextensions-examples repository.
Developer tools are extended with a hidden HTML page that is loaded when the tools are opened. From the hidden HTML page,developer tools panels can be added; these are HTML pages displayed as a tool tab in the browser UI.
To debug development tools pages and panels, use theToolboxDebugger in thesplit console view so you can view theConsole belowDebugger.
To debug additions to the developer tools, open the developer tools and any custom panels, and locate their JavaScript inDebugger.

In theDebugger you can set breakpoints, step through code, modify the extension's state, and doeverything else you'd expect to be able to do in a debugger. Any messages logged by your code display inConsole.
To debug the custom developer tools pages' HTML and CSS:
- switch toInspector.
- click the page selector (1).
- click the custom development tools page item you want to inspect (2).

You canreview and modify the custom development tools page HTML and CSS inInspector, as you would with any webpage.
Debug permission requests
For information on debugging permission requests, seeTest permission requests.
Debugging browser restarts
If your extension could be affected by the browser restarting, such as when a session is restored, you may want to test to ensure your code works as expected in those conditions.
For more details, seeTesting persistent and restart features.
Tags: debugging firefox guide mozilla webextensions
Contributors: majordwarf rebloor irenesmith hellosct1 janat08 MNizam0802 ExE-Boss Dietrich freaktechnik suterj andrewtruongmoz wbamberg CaemU carlin-scott matthewjwein abdullahdiaa aroraharsh010
Last update: aroraharsh010
Up Next
Develop
Temporary installation in Firefox
Develop
Testing persistent and restart features
Develop