numpy.random.standard_t(df,size=None)¶Draw samples from a standard Student’s t distribution withdf degreesof freedom.
A special case of the hyperbolic distribution. Asdf getslarge, the result resembles that of the standard normaldistribution (standard_normal).
| Parameters: |
|
|---|---|
| Returns: |
|
Notes
The probability density function for the t distribution is
P(x, df) = \frac{\Gamma(\frac{df+1}{2})}{\sqrt{\pi df}\Gamma(\frac{df}{2})}\Bigl( 1+\frac{x^2}{df} \Bigr)^{-(df+1)/2}
The t test is based on an assumption that the data come from aNormal distribution. The t test provides a way to test whetherthe sample mean (that is the mean calculated from the data) isa good estimate of the true mean.
The derivation of the t-distribution was first published in1908 by William Gosset while working for the Guinness Breweryin Dublin. Due to proprietary issues, he had to publish undera pseudonym, and so he used the name Student.
References
| [1] | (1,2) Dalgaard, Peter, “Introductory Statistics With R”,Springer, 2002. |
| [2] | Wikipedia, “Student’s t-distribution”http://en.wikipedia.org/wiki/Student’s_t-distribution |
Examples
From Dalgaard page 83[1], suppose the daily energy intake for 11women in Kj is:
>>>intake=np.array([5260.,5470,5640,6180,6390,6515,6805,7515, \...7515,8230,8770])
Does their energy intake deviate systematically from the recommendedvalue of 7725 kJ?
We have 10 degrees of freedom, so is the sample mean within 95% of therecommended value?
>>>s=np.random.standard_t(10,size=100000)>>>np.mean(intake)6753.636363636364>>>intake.std(ddof=1)1142.1232221373727
Calculate the t statistic, setting the ddof parameter to the unbiasedvalue so the divisor in the standard deviation will be degrees offreedom, N-1.
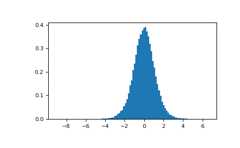
>>>t=(np.mean(intake)-7725)/(intake.std(ddof=1)/np.sqrt(len(intake)))>>>importmatplotlib.pyplotasplt>>>h=plt.hist(s,bins=100,density=True)
For a one-sided t-test, how far out in the distribution does the tstatistic appear?
>>>np.sum(s<t)/float(len(s))0.0090699999999999999 #random
So the p-value is about 0.009, which says the null hypothesis has aprobability of about 99% of being true.