numpy.interp(x,xp,fp,left=None,right=None,period=None)[source]¶One-dimensional linear interpolation.
Returns the one-dimensional piecewise linear interpolant to a functionwith given discrete data points (xp,fp), evaluated atx.
| Parameters: |
|
|---|---|
| Returns: |
|
| Raises: |
|
Notes
Does not check that the x-coordinate sequencexp is increasing.Ifxp is not increasing, the results are nonsense.A simple check for increasing is:
np.all(np.diff(xp)>0)
Examples
>>>xp=[1,2,3]>>>fp=[3,2,0]>>>np.interp(2.5,xp,fp)1.0>>>np.interp([0,1,1.5,2.72,3.14],xp,fp)array([ 3. , 3. , 2.5 , 0.56, 0. ])>>>UNDEF=-99.0>>>np.interp(3.14,xp,fp,right=UNDEF)-99.0
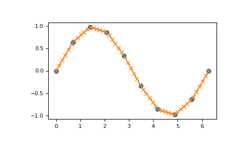
Plot an interpolant to the sine function:
>>>x=np.linspace(0,2*np.pi,10)>>>y=np.sin(x)>>>xvals=np.linspace(0,2*np.pi,50)>>>yinterp=np.interp(xvals,x,y)>>>importmatplotlib.pyplotasplt>>>plt.plot(x,y,'o')[<matplotlib.lines.Line2D object at 0x...>]>>>plt.plot(xvals,yinterp,'-x')[<matplotlib.lines.Line2D object at 0x...>]>>>plt.show()
Interpolation with periodic x-coordinates:
>>>x=[-180,-170,-185,185,-10,-5,0,365]>>>xp=[190,-190,350,-350]>>>fp=[5,10,3,4]>>>np.interp(x,xp,fp,period=360)array([7.5, 5., 8.75, 6.25, 3., 3.25, 3.5, 3.75])
Complex interpolation:
>>>x=[1.5,4.0]>>>xp=[2,3,5]>>>fp=[1.0j,0,2+3j]>>>np.interp(x,xp,fp)array([ 0.+1.j , 1.+1.5j])