

Creating an SLO
To monitor a service, you need at least one service-level objective (SLO).The SLOs encapsulate your performance goals for the service. Every SLO isbased on a performance metric, called a service-level indicator (SLI).For background information on SLIs and SLOs, seeConcepts in service monitoring.
You can create up to 500 SLOs for a service.
Before you begin
To get the permissions that you need to view and create SLOs, ask your administrator to grant you the Monitoring Editor (roles/monitoring.editor). IAM role on your project. For more information about granting roles, seeManage access to projects, folders, and organizations.
You might also be able to get the required permissions throughcustom roles or otherpredefined roles.
Getting started
To define an SLO, navigate to theCreate a Service Level Objective (SLO)pane.
In the Google Cloud console, go to the
 SLOs page:
If you use the search bar to find this page, then select the result whose subheading isMonitoring.
Open theCreate a Service Level Objective (SLO) pane:
For a new service:
- ClickDefine service, and thendefine your service.
- After you clickSubmit in theDefine service pane, clickCreate SLO.
For an existing service:
- In theServices list, click the name of the service in theServices list.
- On theService details page, clickCreate SLO.
The SLO-creation pane leads you through the steps to create an SLO. Theremainder of this document describes each of the following steps in theSLO-creation process:
- Set the SLI.
- Define SLI details.
- Set the SLO.
- Review and save the SLO.
To advance to the next step, clickContinue. You can click a previous stepto make changes before you save the SLO. To exit the SLO-creation process,clickCancel.
Setting your SLI
TheSet your SLI pane has the following sub-panes:
Service details, which reports identifying information about your service.This is the same as theService details pane on the dashboard forthe service.
Choose a metric, where you choose a metric for the performance you wantto monitor.
Request-based or windows-based?, where you choose how the metric is tobe evaluated.
The following screenshot shows the SLI pane:

For more information about metrics used in SLIs and the evaluation methods,see the conceptual topicService-level indicators.
Choosing a metric
The SLI metric specifies the type of performance you want to measure. In theSLI, you build a ratio from the metric to measure good performance over time.You have the following options for SLIs:
- Availability, which measures how available your service is to users.
- Latency, which measures how responsive your service is to users.
- Other, which lets you indicate that you want to use a specific metric.You specify the metric and describe how to build the SLI on theSetSLI details pane.
The valid choices depend on the type of service you are configuring.
For services on Cloud Service Mesh, Istio on Google Kubernetes Engine, and App Engine, you can choose any of the options.The availability and latency metrics are already known for these services,or you chooseOther to use a custom SLI.
For GKE-based services, and for custom services, the onlychoice isOther. Prometheus metrics are not included in defaultavailability and latency SLOs, and other meaningful availability or latencymetrics aren't known in advance for these services.
If you configured collection of Prometheus metrics usingGoogle Cloud Managed Service for Prometheus, you can set a collected Prometheusmetric as a custom SLI.
Choosing the evaluation method
After you select the metric for your SLI, you specify how the metricshould be evaluated.
Request-based evaluation measures the number of requests that meet theevaluation criterion against the total number of requests in a given period.
Windows-based evaluation measures the number of evaluation periods thatmeet a goodness criterion against the total number of evaluation periods.
For both evaluation methods, you specify the evaluation criteria on theSet SLI details page.
For more information on these evaluation types, seeCompliance inrequest- and windows-based SLOs.
Setting SLI details
The contents of theDefine SLI details pane depends on the metric andevaluation method you chose in the previous step.
If you chose the availability metric and request-based evaluation, thereare no other details needed.
Windows-based evaluation
If you selected window-based evaluation, you set the additional criteriafor the window on this pane: a goodness criterion and a duration.
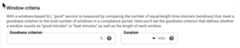
The goodness criterion indicates the percentage of windows that mustevaluate to “good” over the compliance period. The durationspecifies the length of the window.
Latency metric
If you chose the latency metric, you specify the threshold valuethat determines acceptable performance on this pane:

Anything above the latency threshold is considered “bad”performance in evaluating the SLI.
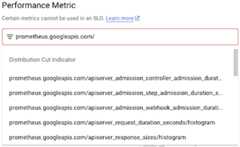
Custom SLI
If you selectedOther as the SLI metric, you specify the metric youwant to use on this pane. You can select a metric by typing in thePerformanceMetric field or select one from the list.
The metrics in the list are divided into two types:
- Distribution-cut indicators
- Time-series ratio indicators
If you are collecting Prometheus metrics with Google Cloud Managed Service for Prometheus, themetric name starts withprometheus.googleapis.com/.
The following screenshot shows a partial list:
If you select a distribution-cut indicator, you configure the SLIby providing a range—above, below, or between—and a filterto specify the monitored resource and any labels you want to include.The configuration pane looks like the following:

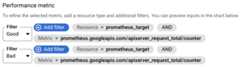
If you select a time-series ratio indicator, you configure the ratioby building numerator and denominator filters to classify the metric data,typically by selecting the values of labels in the metric or resource type.The configuration pane looks like the following:
For more information about these SLI types, see the Monitoring APIreference pages forDistributionCut andTimeSeriesRatio.
GKE control plane metrics
GKE control plane metrics are useful indicators of system healththat you can use for custom SLIs. You mustenable collection of these metrics before you canuse them. These metrics are collected by Google Cloud Managed Service for Prometheus.
- Use [API server metrics][gke-api-metrics] to track API server load, thefraction of API server requests that return errors, and the response latencyfor requests received by the API server.
- Usescheduler metrics to help you to proactivelyrespond to scheduling issues when there aren't enough resources for pendingPods.
For more information about control plane metrics and using them to monitorsystem health, seeUse control plane metrics.
Preview chart
After you have configured the SLI, theDefine SLI details pane includesa preview chart to show you how the historical performance of this serviceis measured by the SLI. For example:
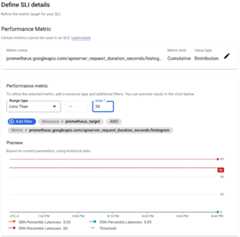
If you have just created or deployed a service, there may not be any datayet. You can still create the SLI, but you won't get the historicalperspective.
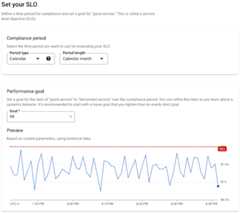
Setting your SLO
TheSet your SLO pane has the following regions:
Compliance period, where you set the time period over which youwant to evaluate the SLI.
Performance goal, where you specify the threshold for performanceover the compliance period.
Preview, which displays a chart that shows the performance-goalthreshold and graph that shows the results of evaluating the SLI overthe compliance period.

Compliance period
There are two types of compliance period, which you select from the menu:
- Calendar period
- Rolling window
A calendar period measures compliance over a fixed period of time, theperiod length. When the period ends, the error budget is reset and anew compliance period starts.
A rolling window is a sliding period. It also has a length, but the complianceis computed over the lastn days. When a new day starts, the complianceand remaining error budget are recomputed over the previousn days.
For more on calendar and rolling-window compliance periods, seeCompliance periods.
Preview chart
After you have configured the SLO, theSet your SLO pane includesa preview chart to show you how the historical performance of this serviceis measured by the SLO. For example:
If you have just created or deployed a service, there may not be any datayet. You can still create the SLO, but you won't get the historicalperspective.
Saving your SLO
TheReview and save pane has a single field, a display namefor the SLO. The field has a default value based on the selectionsyou made while defining the SLO, but you can change it to make thedisplay name more descriptive.
The pane also provides a preview of your SLO in JSON format. The JSON blocksummarizes your SLO and can be copied for use with theserviceLevelObjectives.create method.If you change any of the SLO values, the JSON preview is updated automatically.
The following screenshot shows the field with a default name:

When you are satisfied with the display name, clickCreate SLO.
What's next
After you create an SLO, you can do the following:
Monitor the performance of your service relative to the SLOby creating an alerting policy.For more information, seeAlerting on your burn rate andCreating an alerting policy.
View the status of all the SLOs for a set of services by creatinga custom dashboard in Cloud Monitoring that displays SLO charts.For more information, seeCreate a custom dashboard andDisplay SLOs on a dashboard.
Except as otherwise noted, the content of this page is licensed under theCreative Commons Attribution 4.0 License, and code samples are licensed under theApache 2.0 License. For details, see theGoogle Developers Site Policies. Java is a registered trademark of Oracle and/or its affiliates.
Last updated 2025-12-17 UTC.