

Retrieving SLO data
SLO data is stored in time series. You can retrieve SLO time series byspecifying atime-series selector in thefilter parameter to thetimeSeries.list method or by using thedirectfilter mode in Metrics Explorer.
timeSeries.list method is described inRetrieve time-series data, and general filtering is describedinMonitoring filters.SLO-based alerting policies
If you are creating an alerting policy by using the Cloud Monitoring API,you specify the filter using a time-series selector as a field in the policy'sthreshold condition. For information about how to create SLO-based alertingpolicies by using the Monitoring API, seeCreate an alerting policy.
Only a subset of the time-series selectors available for SLOs can be used inalerting policies.Also, SLO-based alerting policies created with the Google Cloud consolealways use theselect_slo_burn_rate selector.
Using a time-series selector in a filter
To retrieve time-series data for SLOs, your filter must specify a time-seriesselector. SLO data isn't stored with metric types and can'tbe retrieved with the filter that specifies a pair ofmetric and monitored-resource types.
Names and arguments
Time-series selectors have one of the following forms:
SELECTOR_NAME(SLO_NAME)SELECTOR_NAME(SLO_NAME,LOOKBACK_PERIOD)
The selectors have names that start withselect_slo_, and they take one ortwo arguments:
The first argument to the selector is the resource name for an SLO,which looks like this:
projects/PROJECT_ID/services/SERVICE_ID/serviceLevelObjectives/SLO_ID
The previous expression contains three variables:
- PROJECT_ID: Name or number of a Google Cloud project.
- SERVICE_ID: Name of a service.
- SLO_ID: Identifier for an SLO that is defined for the service.
For information about how to find the values for theSERVICE_ID andSLO_ID fields for your Google Cloud project, seeWorking with the API.
The second argument, if supported, is a lookback period.SeeTypes of error-budget alertsfor information about lookback periods.Valid time units are "ns", "us" "ms", "s", "m", "h".
For example, theselect_slo_budget selector takes anSLO_NAME argument,so a filter using this selector looks like the following:
select_slo_budget("projects/PROJECT_ID/services/SERVICE_ID/serviceLevelObjectives/SLO_ID")In contrast, theselect_slo_burn_rate selector requires theSLO_NAME andLOOKBACK_PERIOD arguments,so a filter using this selector looks like the following:
select_slo_burn_rate("projects/PROJECT_ID/services/SERVICE_ID/serviceLevelObjectives/SLO_ID", "3600s")For a list and description of all the selectors, seeTime-series selectors.
Retrieving data with a selector
One way you can query time-series data is to use the APIs Explorer toolon thetimeSeries.list method's reference page.For information about this tool, seeAPIs Explorer.
For example, to retrieve information about an SLO's budget, complete thefollowing fields in the APIs Explorer tool:
- name:
projects/PROJECT_ID - filter:
select_slo_budget("projects/PROJECT_ID/services/SERVICE_ID/serviceLevelObjectives/SLO_ID") - interval.startTime:
2021-10-07T13:00:20-04:00 - interval.endTime:
2021-10-08T13:00:20-04:00
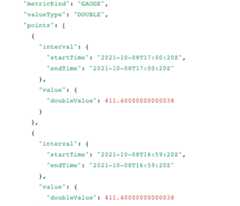
For one system, after variables such asPROJECT_ID are replaced withvalues and the method is executed, the following time series data is returned:
Time-series selectors
This section lists the available time-series selectors for SLOs and describeswhat they represent. All the selectors can be used in filters with thetimeSeries.list method to retrieve time-series data. Not all of them aresupported in alerting policies.
select_slo_burn_rate
Syntax:select_slo_burn_rate(SLO_NAME,LOOKBACK_PERIOD)
The “burn-rate” time-series selector returns the ratio of thecurrent failure rate (the rate of bad requests in the lookback interval)to the sustainable failure rate for the SLO. The sustainable failure rateis the rate at which the SLO is exactly met.
The values in this time series can range from 0 to infinity:
- A value of one indicates that the service exhibits the ideal failurerate: not too risky, not too conservative.
- A value greater than one means the failure rate exceeds the sustainable rate.The higher the value, the sooner the SLO falls out of compliance.
- A value less than one means that the current failure rate is less thanthe sustainable rate.
We recommend that you use two alerting policies to monitor burn rate:a fast-burn policy to alert you to spikes in the burn rate, and a slow-burnpolicy to alert you to gradual increases.
You can create and edit alerting policies based on this time-series selectorby using the API or the Google Cloud console.
All SLO-based alerting policies created by using the Google Cloud consoleuse this selector to retrieve the SLO data.
select_slo_health
Syntax:select_slo_health(SLO_NAME)
The “SLO health” time series answers the question, “During agiven alignment period, what was the ratio of good requests to totalrequests?” The SLI for the service defines what counts as a good request.For more information about SLIs, seeOverview.
This time series measures service performance: if every request tothe service is good, then the data points in this time series have the value 1.As the number of bad requests rise, the values of the data points drop.
select_slo_compliance
Syntax:select_slo_compliance(SLO_NAME)
The “SLO compliance” time series answers the question,“What is the ratio of good units to total units sincethe beginning of the compliance period?” The SLO defines the complianceperiod as a rolling window or a range of calendar time.The unit can be a request or a window of time. For more information, seeCompliance in request- and windows-based SLOs.
This time series gives you a general picture of how well the serviceis meeting the SLO. It doesn't produce an operationally urgent signal.
Don't use this time-series selector in alerting policies.
select_slo_budget
Syntax:select_slo_budget(SLO_NAME)
The “SLO budget” time series answers the question,“How much of the error budget remained at the time of themeasurement?” The error budget might be measured in requestsor minutes, and the amount remaining is computed based on whetherthe compliance period is measured in calendar time or as a rolling window.For more information, seeError budgets.
This time series measures the risk in a service's reliability. If theerror budget becomes less than zero, then it might not be possible to meetthe SLO for the current period.A failure to meet the SLO might have real consequences for anorganization's production environment, depending on how the organizationgoverns reliability.
Don't use this time-series selector in alerting policies.
select_slo_budget_fraction
Syntax:select_slo_budget_fraction(SLO_NAME)
The “SLO budget fraction” time series answers the question,“How much of the error budget, as a fraction from negative infinity toone, remains at this time?”
Don't use this time-series selector in alerting policies.
select_slo_budget_total
Syntax:select_slo_budget_total(SLO_NAME)
The “SLO total budget” time series answers the question,“What is the total error budget (in requests or minutes) thatis projected to be available at this time, based on the behaviorof the service since the start of the compliance period?”The SLO defines the complianceperiod as a rolling window or a range of calendar time.
Don't use this time-series selector in alerting policies.
select_slo_counts
Syntax:select_slo_counts(SLO_NAME)
The “SLO counts” time series answers the question, “Duringa given alignment period, what is the number of good and bad requests?”This selector provides a time series that records general health and is suitablefor ingestion into long-term storage systems.
Don't use this time-series selector in alerting policies.
Except as otherwise noted, the content of this page is licensed under theCreative Commons Attribution 4.0 License, and code samples are licensed under theApache 2.0 License. For details, see theGoogle Developers Site Policies. Java is a registered trademark of Oracle and/or its affiliates.
Last updated 2026-02-19 UTC.