

Visualizing re-identification risk using Looker Studio
This topic shows how to measurek-anonymity of a dataset usingSensitive Data Protection and visualize it in Looker Studio. By doing so, you'llalso be able to better understand risk and help evaluate the trade-offs inutility you might be making if you redact or de-identify data.
Important: You can also visualize your re-identification risk analysis resultsusing Sensitive Data Protection in the Google Cloud console, without needing to useLooker Studio. This built-in feature produces a similar visual representation tothe procedure described in this topic, without having to configure anotherproduct. For more information, seeViewk-anonymity jobresults orViewl-diversityjob results.Though the focus of this topic is on visualizing thek-anonymityre-identification risk analysis metric, you can also visualize thel-diversity metric using thesame methods.
This topic assumes you're already familiar with theconcept ofk-anonymity and its utility forassessing the re-identifiability of records within a dataset. It will also behelpful to be at least somewhat familiar with how tocomputek-anonymityusing Sensitive Data Protection, and with usingLooker Studio.
Introduction
De-identification techniques can be helpful in protecting your subjects' privacywhile you process or use data. But how do you know if a dataset has beensufficiently de-identified? And how will you know whether your de-identificationhas resulted in too much data loss for your use case? That is, how can youcompare re-identification risk with the utility of the data to help makedata-driven decisions?
Calculating thek-anonymity value of a dataset helps answer these questions byassessing the re-identifiability of the dataset's records.Sensitive Data Protection contains built-in functionality to calculate ak-anonymity value on a dataset based on quasi-identifiers that you specify.This helps enable you to quickly evaluate whether de-identifying a certaincolumn or combination of columns will result in a dataset that is more or lesslikely to be re-identified.
Note:Quasi-identifiers are database columns that could potentially be usedin concert with other data to re-identify an individual. For more information,seeRisk analysis terms andtechniquesin theRisk analysis conceptual topic.Example dataset
Following are the first few rows of a large example dataset.
user_id | age | title | score |
|---|---|---|---|
602-61-8588 | 24 | Biostatistician III | 733 |
771-07-8231 | 46 | Executive Secretary | 672 |
618-96-2322 | 69 | Programmer I | 514 |
... | ... | ... | ... |
For the purposes of this tutorial,user_id will not be addressed, as the focusis on quasi-identifiers. In a real-world scenario, you would want to ensurethatuser_id is redacted ortokenized appropriately. Thescore column is proprietary to this dataset, and it's unlikely an attackerwould be able to learn it by other means, so you will not include it in theanalysis. Your focus will be on the remainingage andtitle columns, withwhich an attacker could potentially learn about an individual through othersources of data. The questions you're trying to answer for the dataset are:
- What effect will the two quasi-identifiers—
ageandtitle—have on the overall re-identification risk of the de-identifieddata? - How will applying a de-identification transformation affectthis risk?
You want to be sure that the combination ofage andtitle won't map to asmall number of users. For example, suppose there is only one user in thedataset whose title is Programmer I and who is age 69. An attacker might be ableto cross-reference that information with demographics or other availableinformation, figure out who the person is, and learn the value of their score.For more information about this phenomenon, see the "Entity IDs and computingk-anonymity" section in theRiskanalysis conceptual topic.
Step 1: Calculate k-anonymity on the dataset
First, use Sensitive Data Protection to calculatek-anonymity on the dataset bysending the following JSON to theDlpJob resource. Withinthis JSON, you set theentity ID to theuser_id column, and identify the two quasi-identifiers as both theage andtitle columns. You're also instructing Sensitive Data Protection to save theresults to a new BigQuery table.
JSON input:
POST https://dlp.googleapis.com/v2/projects/dlp-demo-2/dlpJobs{ "riskJob": { "sourceTable": { "projectId": "dlp-demo-2", "datasetId": "dlp_testing", "tableId": "dlp_test_data_kanon" }, "privacyMetric": { "kAnonymityConfig": { "entityId": { "field": { "name": "id" } }, "quasiIds": [ { "name": "age" }, { "name": "job_title" } ] } }, "actions": [ { "saveFindings": { "outputConfig": { "table": { "projectId": "dlp-demo-2", "datasetId": "dlp_testing", "tableId": "test_results" } } } } ] }}Once thek-anonymity job has completed, Sensitive Data Protection sends the jobresults to a BigQuery table nameddlp-demo-2.dlp_testing.test_results.
Step 2: Connect results to Looker Studio
Next, you'll connect the BigQuery table you produced in Step 1to a new report in Looker Studio.
OpenLooker Studio.
ClickCreate >Report.
In theAdd data to report pane underConnect to data, clickBigQuery. You may need to authorize Looker Studio to access your BigQuery tables.
In the column picker, selectMy projects. Then choose the project, dataset, and table. When you're done, clickAdd. If you see a notice that you're about to add data to this report, clickAdd to report.
Thek-anonymity scan results have now been added to the new Looker Studioreport. In the next step, you'll create the chart.
Step 3: Create the chart
Do the following to insert and configure the chart:
- In Looker Studio, if a table of values appears, select it and press Delete to remove it.
- On theInsert menu, clickCombo chart.
- Click and draw a rectangle on the canvas where you want the chart to appear.
Next, configure the chart data under theData tab so that the chart showsthe effect of varying the size and value ranges of buckets:
- Clear the fields under the following headings by pointing to each field and clicking the X, as shown here:
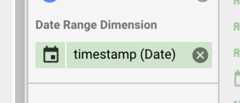
- Date Range Dimension
- Dimension
- Metric
- Sort
- With all fields cleared, drag theupper_endpoint field from theAvailable fields column to theDimension heading.
- Drag theupper_endpoint field to theSort heading, and then selectAscending.
- Drag both thebucket_size andbucket_value_count fields to theMetric heading.
- Point to the icon to the left of thebucket_size metric and anEdit icon appears. Click theEdit icon, and then do the following:
- In theName field, type
Unique row loss. - UnderType, choosePercent.
- UnderComparison calculation, choosePercent of total.
- UnderRunning calculation, chooseRunning sum.
- In theName field, type
- Repeat the previous step for thebucket_value_count metric, but in theName field, type
Unique quasi-identifier combination loss.
Once you're done, the column should appear as shown here:

Finally, configure the chart to display a line chart for both metrics:
- Click theStyle tab in the pane on the right of the window.
- For both Series #1 and Series #2, chooseLine.
- To view the final chart on its own, click theView button in the upper-right corner of the window.
Following is an example chart after completing the preceding steps.

Interpreting the chart
The generated chart plots, on they-axis, the potential percentage of dataloss for both unique rows and unique quasi-identifier combinations to achieve,on thex-axis, ak-anonymity value.
Higherk-anonymity values indicate less risk of re-identification. To achievehigherk-anonymity values, however, you would need to remove higherpercentages of the total rows and higher unique quasi-identifier combinations,which might decrease the utility of the data.
Thankfully, dropping data is not your only option to reduce re-identificationrisk. Other de-identification techniques can strike a better balance betweenloss and utility. For example, to address the kind of data loss associated withhigherk-anonymity values and this dataset, you could try bucketing ages orjob titles to reduce the uniqueness of age/job title combinations. For example,you could try bucketing ages in ranges of 20-25, 25-30, 30-35, and so on. Formore information about how to do this, seeGeneralization andbucketing andDe-identifying sensitive data in textcontent.
Except as otherwise noted, the content of this page is licensed under theCreative Commons Attribution 4.0 License, and code samples are licensed under theApache 2.0 License. For details, see theGoogle Developers Site Policies. Java is a registered trademark of Oracle and/or its affiliates.
Last updated 2025-12-17 UTC.