

Components of the metric model
Cloud Monitoring's model for monitoring data consists of three primaryconcepts:
- Monitored-resource types
- Metric types
- Time series
The documentThe metric model describes theseCloud Monitoring concepts in general terms. If these concepts are new toyou, read that page first.
This page describes metric types, monitored resources, and timeseries, along with some related concepts, in more detail. Theseconcepts underlie all Monitoring metrics.
You should understand the information on this page if you want to do any of thefollowing:Inspect metric data by usingMetrics Explorer.
Create alerting policies to notify you when a value goes outsideits normal limits, as described inUsing alerting policies.
Retrieve raw or aggregated monitoring data using the Monitoring API,as described inRetrieve time-series data.
Create your own metric types, as described inUser-defined metrics overview.
A word about labels
Monitored-resource types and metric types both supportlabels, which allowdata to be classified during analysis. For example:
- A monitored-resource type for a virtual machine might include labels forthe location of the machine and the project ID associated with the machine.When information about the monitored resource is recorded, the informationincludes the values for the labels. A monitored resource might also havesystem- or user-provided metadatalabels, in addition to the labels defined for the monitored-resource type.
- A metric type that counts API requests might have labels to record the nameof the method invoked and the status of the request.
The use of labels is discussed in more detail inLabels.
Monitored-resource types
Amonitored resource is a resource from which metric data is captured.Cloud Monitoring supports approximately 270types of monitored resources.
Types of monitored resources include generic nodes and tasks, architecturalcomponents in Google Kubernetes Engine, tables in Bigtable, variousAWS resources, and many more.Each type of monitored resource is formally described in a data structurecalled amonitored-resource descriptor. For more information, seeMonitored resource descriptors.
Each of the supported monitored-resource types has an entry in theMonitored resource list. The entries in the list are createdfrom the monitored-resource descriptors. This section describes the informationcaptured in a monitored-resource descriptor and shows how it is presented inthe list.
A sample monitored-resource type
The following image shows theentry in the list fora Cloud Storage bucket:
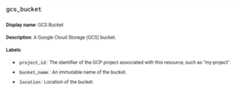
All entries in the list include the following information:
- Type: The header in the entry lists the monitored-resource type;
gcs_bucketin the example. - Display name: A short description of the monitored resource.
- Description: A longer description of the monitored resource.
- Labels: A set of dimensions for classifying data. For more information,seeLabels.
Metric types
Ametric type describes measurements that can be collected from a monitoredresource. A metric type includes a description of what is being measured andhow the measurements are interpreted.Cloud Monitoring supports approximately 6,500 typesof metrics, and it provides you the ability to define new types.Metric types include counts of API calls, disk-usage statistics, storageconsumption, and many more.
Each metric type is formally described in a data structure called ametric descriptor. For more information, seeMetric descriptors.
Each of the built-in metric types has an entry in theMetrics listpages. The entries in these tables are created from the metric descriptors.This section describes the information captured in a metric typeand shows how it is presented in reference material.
A sample metric type
The following image shows an entry for a Cloud Storage metric type:
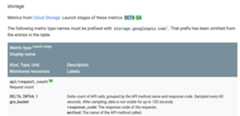
The metric types are displayed in a table, and the table header explainsthe layout of the information. This section uses one entry as an example,but all the tables use the same format.
The sample Cloud Storage table entry gives you the followinginformation about one metric type:
Metric type: An identifier for the metric type,
storage.googleapis.com/api/request_countin the example.The prefix
storage.googleapis.comacts as a namespace forCloud Storage. All metric types associated with a particularmonitored-resource type use the same namespace.Namespaces are omitted from entries in the tables.
All the metric types associated with Cloud Storage are listedin thetable for Cloud Storage metrics.
Launch stage: A colored block that indicates the launch stageof the metric type with a value like Alpha, Beta, and GA.
Display name: A brief string describing the metric type,“Request count” in the example.
Kind, Type, Unit: This line provides information for interpretingthe data values: the example shows a delta metric recorded as a64-bit integer with no unit (that's the
1value).Kind: This example is adelta metric, which records a change over aperiod of time. That is, each data point records the number of API calls sincethe previous data point was written. For more information on kinds,seeValue types and metric kinds.
Type: This example records its values as 64-bit integers. For more informationon types, seeValue types and metric kinds.
Unit: This metric doesn't need an explicit unit because it represents acount; the digit
1is used to indicate that no unit is needed.
Monitored resources: The monitored resources for which this metrictype is available. The values here are the same as those described inMonitored-resource types.
Description: More detailed information about what is recorded and how.Set in italics to distinguish it from the labels.
Labels: A set of dimensions for classifying data. For more information,seeLabels.
When you access monitoring data through the Cloud Monitoring API, you includea Google Cloud project in the API call. You can retrieve only the data that isvisible to that Google Cloud project. For example, if you requestyour project's data for the metric typestorage.googleapis.com/api/request_count,then you see API counts only for Cloud Storage buckets in your project.If your project isn't using any Cloud Storage buckets, then no metricdata is returned.
Built-in metric types
Built-in metric types are defined by Google Cloud services, includingCloud Monitoring.These metric types describe standard measurements for a wide array of commoninfrastructure and are available for anyone to use.
TheMetrics list shows the entire set of built-in metric types.Metrics listed in theExternal metrics list page are a specialsubset of built-in metrics that are defined by Cloud Monitoring inpartnership with open-source projects or third-party providers. Typically, thesemetrics have a prefix ofexternal.googleapis.com.Custom metrics
When you build your application, you might have certain properties youwant to measure, things for which there are no metrics built intoCloud Monitoring. With Cloud Monitoring, you can define your ownmetric types or import metric types from external sources. These metric typesare calledcustom metrics. If a metric has a prefix ofcustom.googleapis.comorprometheus.googleapis.com, then it is a custom metric.The latter metrics usually come fromGoogle Cloud Managed Service for Prometheus.
For example, if you want to track the number of widgets soldby your stores, you need to use a custom metric.For more information, seeUser-defined metrics overview.
Labels
A label is key-value pair that can be used to provide information abouta data value.
Metric and monitored-resource labels
The definitions of both metric and monitored-resource types include labels.Labels are classifiers for the data being collected; they help tocategorize the data for deeper analysis. For example:
- The Cloud Storage metric type
storage.googleapis.com/api/request_counthas two labels,response_codeandmethod. - The Cloud Storage monitored-resource type
gcs_buckethas three labels,project_id,bucket_name, andlocation.The labels identify specific instances of the resource type.
Therefore, all data collected for API requests from a Cloud Storagebucket is classified by the method that was called, the response codefor the call, the name, location, and project of the bucket involved.The set of labels varies with the metric or monitored-resource type; theavailable labels are documented in theMetrics list andMonitored resource list pages.
By tracking the response code, method name, and location when counting APIcalls, you can then fetch the number of calls to a particular APImethod, or the number of failing calls to any method, or the numberof failing calls to a specific method in a specific location.
The number of labels and the number of values each can assume is referred toascardinality. The cardinality is the number of possible time series thatmight be collected for a pair of metric and monitored-resource types:there is one time series for each combination of values of their labels.For more information, seeCardinality: time series and labels.
Resource metadata labels
In addition to the labels defined on the metric and monitored-resource types,Monitoring internally collects additional information onmonitored resources and stores this information in system metadata labels.These system metadata labels are available to users as read-only values.Some resources also allow users to create their own resource metadata labelswhen configuring resources like VM instances in the Google Cloud console.
The system and user metadata labels are collectively calledresource metadatalabels. You can use these labels like the labels defined on the metric andmonitored-resource types in time-series filters.
Resource metadata labels only appear in the query result if you explicitlyaggregate by them.
For more information onfiltering, seeMonitoring filters.
Time series: data from a monitored resource
This section discusses what monitoring data is and how it's organizedin time series. This is where the conceptual components of themetric model become concrete artifacts.
Cloud Monitoring store regular measurements over time for pairs of metricand monitored-resource types. The measurements are collected intotime series,and each time series contains the following items:
The name of the metric type to which the time series belongs, andone combination of values for the metric's labels.
A series of (timestamp,value) pairs. Thevalue is the measurement,and thetimestamp is the time at which the measurement was taken.
The monitored resource that is the source of the time series data, andone combination of values for the resource's labels.
A time series is created for each combination of metric and resource labelsthat generates data.
Stylized example: The metric typestorage.googleapis.com/api/request_countcould have many time series for your project's Cloud Storagebuckets. The following illustration shows some possible time series.
In the illustration, the valuebucket: xxxx represents the value of thebucket_name label in the monitored-resource type, andresponse_code andmethod are labels in the metric type. There is one time series for eachcombination of values in the resource and metric labels; the illustrationsshows some of them:
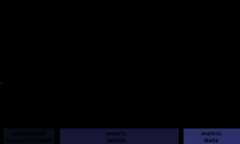
Cloud Monitoring doesn't record “empty” time series. In theCloud Storage buckets example, if you're not using a particular bucketor never call a particular API method, then no data is collected for thatlabel, and no time series mentions it. This means that, if your projecthas no data at all for a particular metric, you never see the metric type.
The metric types don't indicate what types of monitored resourcesare found in the metrics' time series. For Cloud Storage, there is only onemonitored resource type—gcs_bucket. Some metric types pair with morethan one monitored resource.
Live example: If you have a Google Cloud project, youcan try the APIs Explorer widget, located on the reference page for thetimeSeries.list method in the Monitoring API.
Open the
timeSeries.listreference page.In the pane labeledTry this method, enter the following:
- name:
projects/PROJECT_IDReplacePROJECT_IDwiththe ID of your Google Cloud project. - filter:
metric.type="logging.googleapis.com/log_entry_count" resource.type="gce_instance" - interval.start_time: Enter the start time and ensure that it is20 minutes earlier than the end time.
- interval.end_time: Enter the end time.
- name:
If the request succeeds, it will return the time-series data that matches therequest. It will look like the following snippet:
{ "timeSeries": [ { "metric": { "labels": { "severity": "INFO", "log": "compute.googleapis.com/activity_log" }, "type": "logging.googleapis.com/log_entry_count" }, "resource": { "type": "gce_instance", "labels": { "instance_id": "0", "zone": "us-central1", "project_id": "your-project-id" } }, "metricKind": "DELTA", "valueType": "INT64", "points": [ { "interval": { "startTime": "2024-03-29T13:53:00Z", "endTime": "2024-03-29T13:54:00Z" }, "value": { "int64Value": "0" } }, ... ] }, ... ]}For more information on using the APIs Explorer widget, includingtroubleshooting, seeAPIs Explorer.
Cardinality: time series and labels
Every time series is associated with a specific pair of metric andmonitored-resource types. The metric and monitored-resource typeseach provide some number of labels. In Cloud Monitoring, the number ofunique combinations of values for the set of labels is the cardinality ofthe metric type or monitored-resource type. These values are referred to asmetric cardinality andresource cardinality, and they determine how manypossible time series, thetotal cardinality, might be generated.
Metric, resource, and total cardinality
Suppose you have a metric type that specifies two labels,color andzone. The metric cardinality depends on the number of possiblevalues those labels have:
- If there are only three possible colors, “red,”“green,” and “blue,” then the
colorlabel canhave up to three distinct values. - If there are only two possible zones, “east” and“west”, then the
zonelabel can have up to two distinct values.
The cardinality of this metric is 6 (3×2). If there are 1,000 possiblevalues for thecolor label, and if every color can appear in every zone, thenthe metric cardinality is 2,000 (1,000×2). The same calculation appliesif these are labels on a monitored-resource type rather than on a metric type.
This cardinality value is a maximum, based on the number of combinationsof possible label values. The effective, real-world value might be significantlylower when all combinations of label values don't actually occur. For example,if each color appears in only one zone, not in both zones,then the maximum number of time series you see in the running system is1,000. But the usefulness of effective cardinality depends on the reasonsthat certain combinations don't appear and whether they might in the future.

When time series data is written, it is classified by metric andmonitored-resource types. For any pair of metric and resource types, thetotal cardinality is the product of the metric cardinality and the resourcecardinality. If you have a metric with cardinality of 1,000, and a resourcewith cardinality of 100, and if every label value appears, then you have 100,000time series (1,000×100).
When designing your own metrics, ensure that the set of possiblevalues for any label is constrained. A small set of discrete values(like “red,” “green,” and “blue,”) isthe preferred approach. If, for example, you use 8-bit RGB values for acolor label, you can have over 16 million differentvalues. Donot use high-resolution values like timestamps,any kind of unique identifier, user IDs, IP addresses, unparameterizedURLs, and so forth, for metric labels.Query performance and cardinality
When you issue a query for data, the volume of data you request isthe biggest factor in query performance: a query for one hour of datais generally faster than the same query covering six months. But the volumeof data returned by a request is also sensitive to the number of time seriesin a request. A query retrieving two months of data for a low-cardinalitymetric is likely to be faster than another query retrieving two months ofdata for a very high-cardinality metric, because of the amountof data being retrieved.
Cardinality depends primarily on the number of values your labels can have,not on the number of labels. In general, you don't have control over thecardinality of resources, as when the number of pods or VMs changes basedon business needs. But when ingesting metrics into Cloud Monitoring,rather than using system metrics, you often have some controlover metric cardinality. For example, with user-defined custom metrics,you determine the labels and the possible values for them. If you areingesting Prometheus metrics, you can userelabeling to modifythe set of labels and drop time series you don't want to ingest.
You can use the Cloud MonitoringMetrics Management page toidentify metrics that might have cardinality problems.To view theMetrics Management page, do the following:
In the Google Cloud console, go to the Metrics management page:
If you use the search bar to find this page, then select the result whose subheading isMonitoring.
- In the toolbar, select your time window. By default, theMetrics Management page displays information about the metrics collected in the previous one day.
For more information about theMetrics Management page, seeView and manage metric usage.
For technical background about the way Cloud Monitoring stores andretrieves time series data, seeMonarch: Google's Planet-ScaleIn-Memory Time Series Database.
For information about limits on user-defined metrics in Cloud Monitoring,seeUser-defined metrics.
Except as otherwise noted, the content of this page is licensed under theCreative Commons Attribution 4.0 License, and code samples are licensed under theApache 2.0 License. For details, see theGoogle Developers Site Policies. Java is a registered trademark of Oracle and/or its affiliates.
Last updated 2025-12-15 UTC.