

View logs by using the Logs Explorer
This document provides you with an overview of the Logs Explorer in theGoogle Cloud console, which you can use to retrieve, view, and analyze log entriesthat are stored inlog buckets. Viewing and analyzingindividual log entries and a sequence of log entries can helpyou troubleshoot problems. You can also read log data by using theLogging API and theGoogle Cloud CLI.
To perform aggregate operations on your log entries, like counting the number oflog entries that contain a specific pattern, upgrade the log bucket to useLog Analytics, and then run queries from theLog Analyticspage of the Google Cloud console. You can continue to use theLogs Explorer to view logs in log bucketsthat have been upgraded to use Log Analytics.For more information, seeLog Analytics overview.
The remainder of this document describes how to use the Logs Explorer.
Before you begin
To get the permissions that you need to use the Logs Explorer to view log entries, ask your administrator to grant you the following IAM roles:
- To view log entries in the
_Requiredbucket and those in the_Defaultview on the_Defaultbucket, or to select a log scope:Logs Viewer (roles/logging.viewer) on your project, folder, or organization. - To view all log entries in the
_Requiredand_Defaultbuckets:Private Logs Viewer (roles/logging.privateLogViewer) on your project, folder, or organization. - To view restricted
LogEntryfields in a log bucket:Log Field Accessor (roles/logging.fieldAccessor) on the project, folder, or organization that stores the log bucket. For information about how to restrict access toLogEntryfields, seeConfigure field-level access. - To view and download log entries stored in alog view on a log bucket:Logs View Accessor (
roles/logging.viewAccessor) on the project, folder, or organization that contains the log bucket. For information about how to get access only to a specific log view, seeControl access to a log view
For more information about granting roles, seeManage access to projects, folders, and organizations.
You might also be able to get the required permissions throughcustom roles or otherpredefined roles.
Get started
To begin using the Logs Explorer, do the following:
In the Google Cloud console, go to theLogs Explorer page:
If you use the search bar to find this page, then select the result whose subheading isLogging.
Select a Google Cloud project, folder, or organization.ForApp Hubconfigurations, select the App Hub host project or management project.
The log entries displayed by theLogs Explorer page depend on thefollowing:
- The resources searched for log entries.
- The time-range setting.
- Your Identity and Access Management (IAM) roles on the searched resources.
- Your query filters the search results.For example, adding the query
severity>=ERRORresults inthe display listing only those log entries with a severity level of atleastERROR.
By default, theLogs Explorer page searchesthe resources listed in the defaultlog scopefor log entries. When the default log scope isn't accessible,the page searches for the log entries that originate in your selectedproject, folder, or organization. For projects, the search results includethe log entries that are routed to the project by a sink in another project,and then stored in a log bucket.
After theLogs Explorer page opens, you canselect which resources are searched for log entries by theLogs Explorer. However, your selection applies only to yourcurrent session.
Logs Explorer interface
The Logs Explorer interface lets you display log entries, parse and analyzethem, and specify query parameters. The Logs Explorer contains the followingsections, which are detailed on this page:

Primary toolbar
Using the primary toolbar, you can do the following:
- menu_bookQuery library: View saved, recent, and suggestedqueries. For more information,seeSave and share queries.
- linkShare link: Create a shortened URL of the query andcopy it to your clipboard, making it easier to share a query.The copied URL has the corresponding absolute time range represented by thetime range of your query; for example,
7:49:37 PM - 8:49:37 PM. - settingsPreferences: Adjust the view of theLogs Explorer page, and customize the format of your query results. Formore information, seeSet preferences for viewing log data.
- Time-range selector: Specify a time range for the log entries that youwant to view. For more information, seeuse the time-range selector.
- Stream logs: View log entries as Logging stores them inlog buckets. For more information, seeStream logs.
- schoolLearn: View links to relevant documentation and topics.
View recent, saved, and suggested queries
To view queries that you recently run, queries that you saved forfuture use, and suggested queries, click themenu_bookQuery library button.
In theQuery library tab, you can view the following:
Recent queries: View queries that you have recently run. For moreinformation, seeUse recent queries.
Saved queries: View your saved queries and queries that otherusers of the Google Cloud project have shared with you. For moreinformation, seeSave and share queries.
Suggested queries: View suggested queries based on the resources inyour Google Cloud project. For more information, seeUse suggested queries.
Queries provided by Google Cloud: View queries provided by Google Cloudbased on common use cases for various Google Cloud services. For moreinformation, seeSelect queries from the library.
Set preferences for viewing log data
To customize how your logs data is presented in the query results, click thesettingsPreferences button, and selectView,Format, orManage summary fields:
To show or hide theTimeline andFields panes, to hide summarychips in your query results, or to change the sorting order of your logs,selectView.
To configure theTime column of your query results, selectFormat. For more information, seeConfigure theTime column.
To show up to 10 lines for each log entry, selectFormat and clickWrap lines. By default, the content of each log entry is truncated tofit into one line. Blank spaces are preserved in each log entry.
To find patterns in your logs by using summary fields, selectManagesummary fields. For more information, seeFind patterns in your logs by using summary fields.
Configure theTime column
TheTime column in theQuery results pane displays the timestamps ofyour log entries. You can customize theTime column so that only certainparts of the timestamp are visible. This creates more horizontal space so thatyou can view more information in the log entry.
To select which parts of the timestamp to display, click thesettingsPreferences menu, selectFormat, and then selectone of the following options:
Date, time, and timezone
Date and time (default)
Time only
Find patterns in your logs by using summary fields
Suppose you're looking through the log entries in your query results and want toquickly skim the results by a certainLogEntry field. Or perhapsyou want to group your log entries by a certain field-value pair. You can addsummary fields to your results, which appear as chips at the beginning of eachlog entry line.
The Logs Explorer offers default summary fields and custom summary fields.Default summary fields depend on your current query results, and custom summaryfields let you select any field in theLogEntry.
To show or hide all summary field chips in your query results, clicksettingsPreferences button, selectView, thenShow summary chips. When this option is enabled, the results aredisplayed in raw-text format.
To hide specific summary fields, enableSummary fields, and then clickHide summary field.To modify summary fields, do the following:
Click thesettingsPreferences button, and selectManage summary fields.
In theManage summary fields dialog, you can do the following:
Add any custom field names toCustom summary fields.
The summary field supports auto-completion and field correction forlegal characters within quotes. For example, if you type
jsonPayload.id-field, it gets changed tojsonPayload."id-field".You can also select any
LogEntryfield, regardless ofwhether it is suggested to you with the autocomplete function.To remove an existing custom summary field, click the
Xin its chip.Turn truncation on and off for your custom summary fields.
To shorten the display of the summary field values, use thetoggle_off toggle next toTruncate custom summary fields.You can choose how many characters to display before the field istruncated, and whether the beginning or the end of the field isdisplayed.
Tip: To display a summary field's full value, hold the pointerover a truncated summary field in your query results.Hide or show default summary fields:
To customize which default summary fields are shown in your query results,expand theHide or show default summary fields menu.
ClickApply.
Your summary fields are now updated in your query results.
View logs by time range
To specify a time range for the log entries that you want to view, usethetime-range selector.
To perform a forced refresh of your query results to include the current time,clickJump to now.
Stream logs
You canstream logs asLogging stores them in log buckets, or you can add a query tostream only those logs that match the query.
To stream logs based on a query, add a query in theQuery pane, andthen select theStream logs button in the primary toolbar. AsLogging stores the logs data in log buckets, only those logsthat match the query are shown in theQuery results pane. When a queryisn't provided, Logging shows each log entry as it's stored.
To stop streaming, clickstopStop stream, or manuallyscroll to pause the stream.
Query pane
To build a query in the Logs Explorer, use the query pane. In the querypane, you can build and refine queries by using the following features:
Select which resources are searched for log entries.Queries that you write filter the log entries returned by the search.
Search all fields: Find log entries that match your search terms or phrases.Any search terms added to theSearch all fields field are added tothe query-editor field and are evaluated as part of your query expression.For more information, seeSearch for text across log fields.
Filter menus: Build queries by using various menus to select resources,log names, severity levels, and correlation to other logs.For more information, seeUse filter menus.
Query-editor field: Build advanced queries by using theLogging query language. If you don't see the query-editor field, enableShow query. For more information, seeWrite advanced queries using the Logging query language.
Note: When a query contains multiple statements,you can either specify how those statements are joined or rely on Cloud Logging implicitlyadding the conjunctive restriction,AND, between the statements. For example,suppose a query or filter dialog contains two statements,resource.type = "gce_instance"andseverity >= "ERROR".The actual query isresource.type = "gce_instance" AND severity >= "ERROR".Cloud Logging supports both disjunctive restrictions,OR, and conjunctiverestrictions,AND. When you useORstatements, we recommend that yougroup the clauses with parentheses. For more information, seetheLogging query language documentation.
After you review your query, clickRun query. Logs that matchyour query are listed under theQuery results pane. TheTimeline andFields panesalso adjust according to the query expression.
Select which resources are searched for log entries
This section describes how to view or change which resources are searched forlog entries. If you enter a query, then the Logs Explorer displays only thefetched log entries which also match the query.For example, adding the queryseverity>=ERROR results inthe display listing only those log entries with a severity level of atleastERROR.
To determine which log entries to display, theLogs Explorer pagesearches the resources listed in thedefaultlog scope.When the default log scope isn't accessible,the page searches for the log entries that originate in your selectedproject, folder, or organization. When projects are searched, the search resultsinclude the log entries that are routed to the project by a sink in anotherproject, and then stored in a log bucket.
Note: To configure which resources are searched when theLogs Explorer page opens, set the default log scope.For more information, seeCreate and manage log scopes.For your current session, you can configure which resources theLogs Explorer searches for log entries. For example, when troubleshooting,you might want to examine only those log entries that are included in alog view or that originate in a specificGoogle Cloud project.
The toolbar in theQuery pane displays the resources searched forlog entries:
 Project logs and
 _Default:Log entries that originate in the selected project, folder, or organizationare returned. For projects, these log entries include those that are routedto the project by a sink in another project.
 N log view: Log entries included in theN log viewsare returned. You can expand the menu to list the log views.
- my-custom-scope, where "my-custom-scope" is the name ofa custom log scope: If a log scope lists log views, then thelog entries in those log views are returned. If a log scope listsother resources, like projects, then log entries that originate in thoseresources are returned. For more information, seeCreate and manage log scopes.
When you want to change which resources are searched for log entries, do thefollowing:
Go to the toolbar of theQuery pane. This toolbar displays a menu thatis labeled like one of the following:
- Project logs
- N log view
- my-custom-scope
Select the menu.
In theRefine scope flyout, select the storage location, and thencomplete the dialog.
The following information might help you complete the dialog:
When you want to view log entries routed by anaggregated sink, select
Log view as the storage location. Be sure tothen select all log views that store log entries that you want to view.For folders and organizations, the log view menu lists alllog views that store log entries that originated in those resources.
For projects, the log view menu lists the log views on log buckets storedby the selected project.
To modify the log-view menu to include log views on log bucketsstored in a specific project,click add_circle Import project, and then selectthe project.
- To configure a log scope, selectLog scope, and then clickManage scopes.
Fields pane
TheFields pane offers a high-level summary of logs data and provides anefficient way to refine a query. The entries in this pane also list theapproximate number of log entries that match the corresponding filter. To getan exact count of the number of log entries received in a time interval, useLog Analytics orcopy logs to a Cloud Storage bucket.
After you execute a query in the query-editor field, theFields pane ispopulated based on the results of the query. The pane is divided into thefollowing sections:
Pinned: Shows fields that you pinned for quick access. If this sectionisn't shown, then you haven't pinned any fields.
System metadata: Shows log entries broken down by different dimensions,corresponding to fields in the log entries.
JSON payload (most frequent): Shows the most frequent
json_payloadfields in the current query results.
For theSystem metadata section, the following dimensions are alwaysavailable:
Resource type
If you use BindPlane to write on-premise and hybrid cloud logs,then select the resource typeGeneric Node.
Severity
If you want your query to filterby multiple severity levels, then use theSeverity menu.
Some dimensions are dynamically populated based on the labels in your logdata. For example, you might see aService orApplication dimension:
TheService dimension is shown in the following scenarios:
You have log data whose resource type isKubernetes Containerand you haven't filtered your logs by resource type.The values in the
labels.k8s-pod/applabel contribute to thethe entries in theService dimension.For example, if a log entry similar to the following is displayed as a resultof your query, then the service menu includes the service named
myservice:{...labels: { compute.googleapis.com/resource_name: "mycluster1"k8s-pod/app: "myservice" k8s-pod/pod-template-hash: "5ffcd94fdd" } logName: "projects/my-project/logs/stdout" resource: { labels: {6} type: "k8s_container" } ...}You have log data with labels for anApp Hubservice or workload. These labels are of the form
apphub.workload.idorapphub.service.id. In your log entry, they are shown in theapphubentry. For example, a log entry might contain something like thefollowing:apphub: { application: {3} workload: { criticalityType: "MEDIUM" environmentType: "STAGING"id: "my-workload-id" }}You filter your log data by the resource type ofAudited Resource.The values in the
resource.labels.servicelabel contribute to thethe entries in theService dimension.You have log data that contains the
resource.labels.namespace_nameor thelabels.service.namelabel.
TheApplication dimension is shown whenyour log data contains anApp Hub application ID label,which is of the form
apphub.application.id. In your log entry,this label is shown in theapphubentry:apphub: { application: { container: "projects/my-project"id: "my-app" location: "my-app-location" } workload: {3}}
Other dimensions, likeProject ID, are listed based on yourselections. For example, theProject ID dimension is listed when yourquery restricts the log entries to those whose resource type isKubernetes Container, or when you'veselecteda log view.
Refine your query
To refine your query, select a value from theFields pane. For example,if you selectError in theSeverity heading, then thequery pane is updated to includeseverity=ERROR.
To remove a selection, click theClear button.
Add fields toFields pane
You can add certainLogEntry key-value pairs to theLogs fieldpane from the log entries populated in theQuery results pane. For example,if you frequently filter by the value of thejsonPayload.message field, thenadd it to theFields pane.
To add a field to theFields pane, do the following:
Select a log entry and clickchevron_rightExpand.
Find the field that you want to add to the panel, select the value, and inthe menu, selectPin to Fields panel.
The custom field appears in theFields pane as a list ofkey-value pairs.
If thePin to Fields panel isn't listed, then you can't add the field tothe pane. For example, you can't add the
insertIDfield to theFieldspane.
To remove a custom field from theFields pane, clickRemove next tothe field.
Note that the following types of fields can't be added to theFieldspane:
- Fields related to time; for example,
receiveTimestampandprotoPayload.startTime. - Fields with high cardinality; for example,
insertIdandprotoPayload.latency. - Fields with array indexes in their path; for example,
protoPayload.authorizationInfo[0].resource.
Timeline
Note: Each element of the timeline displays the approximate number oflog entries received in the time interval associated with the element.To get an exact count of the number of log entries received in a time interval,use Log Analytics orcopy logs to a Cloud Storage bucket.With theTimeline pane, you can visualize the distribution of logs overtime.The timeline regenerates when you run a query, making it easier to see trendsin your logs data and troubleshoot problems.
To show or hide theTimeline pane, clickCollapse timeline.
Timeline features
Timeline bars: Each timeline bar represents a time range. Each bar containsa three-color breakdown for the log-severity levels captured in each bar'stime range. The colors represent the following log severities:
- Blue: Low severities such asDefault,Debug,Info,andNotice.
- Yellow: Medium severities such asWarning.
- Red: High severities such asError,Critical,Alert, andEmergency.
Each bar in theTimeline features a menu with options toanalyze your logs.
Time controls: Let you adjust the time range of the logs you see intheQuery results pane. For details onthese options, seeAnalyze logs using time controls.
Time range: Shows you the time range of the logs, represented byhistogram bars. The timeline helps to orient you to the logs you're viewingwithin the larger time range of your query.
Analyze logs using time controls
You can use time controls in the timeline to help you investigate andanalyze your logs data.
Tip: When you adjust the timeline's time controls, the logs data in theQuery results andFields panes adjusts according to the time rangecaptured by the timeline. Adjusting the timeline's time controlsdoesn't alter the query expression in theQuery pane.Adjust time controls
The timeline provides time controls that let you adjust the data thatyou see in the Logs Explorer:
Time handles: Drag the timeline's handles inward to narrow the data oroutward to widen the data in the timeline. ClickRun.
Slide the timeline forward and backward: Clickchevron_rightForward arrowto slide the timeline to a later time. Clickchevron_leftBackward arrowto slide the timeline to an earlier time.
Zoom in and out: Clickzoom_outZoom-outto broaden the data shown in the timeline. Clickzoom_inZoom-into narrow the data shown in the timeline.
Hide timeline: ClickCollapse timeline tohide the timeline.
Timeline modifications are constrained to be between the current time("now") and up to 30 days in the past.
Scroll or zoom to time
In addition to the time controls previously listed,the timeline provides theScroll totime andZoom to time features to give you more in-depth control of thetimeline and the data that you see in other panes in the Logs Explorer.Perhaps a particular bar in the timeline interests you based on its relativesize or severity levels. You can select that bar to adjust the logs data yousee in the Logs Explorer.
You can use theScroll to time feature to browse your logs data without changingthe values in theTimeline andFields panes. When you select theScroll to time feature, the following happens:
The logs data that you see in theQuery results pane adjustsaccording to the time range captured by the selected timeline bar.
The query isn't run, but a partial reload of the data might occur to ensureyou're seeing logs in theQuery results pane that correspond with theselected timeline bar's time range.
The console URL updates to contain the
timestampof the most recent logcaptured by the time range of the selected timeline bar.
To select theScroll to time feature, do the following:
Hold the pointer over a bar in the timeline.A pane containing summaryinformation about the logs data for the specified time range appears.
In the pane, selectScroll to time.
Alternatively, clicking on a timeline bar isequivalent to selectingScroll to time.
TheZoom to time feature is similar toScroll to time, but it runs aquery on your logs data based on the time range captured by a selected timelinebar. When you select theZoom to time feature, the following happens:
- The logs data that you see in theQuery results pane reloads andnarrows according to the time-range restriction of the selected timelinebar.
- The console URL updates to contain the
timestampof the most recent logcaptured by the time range of the selected timeline bar. - The timeline changes to show only logs that have a
timestampvalue thatfalls within the time range of the selected timeline bar.by the selected timeline bar. - The data in theFields pane adjusts according to the time rangecaptured by the selected timeline bar.
To select theZoom to time feature, do the following:
Hold the pointer over a bar in the timeline.A pane containing summaryinformation about the logs data for the specified time range appears.
In the pane, selectZoom to time.
View your query results
TheQuery results pane displays the result of your query. This pane alsoincludes features that help you troubleshoot your applications. For example,you can view more details for each log entry, view similar log entries, andsearch for patterns and strings in your log entries.
Highlight search terms, monitor and download your logs
There are various options to analyze your logs data by selecting theActions menu of theQuery results toolbar:
- Highlight in results: Enter text to behighlighted in your query results.
- add_chartCreate metric: Set up alog-based metric.
- call_mergeCreate sink: Create a log sink that auto-populatesthe sink's inclusion filter with the current query expression.
add_alertCreate log alert: Set up alog-based alerting policy.
editManage alerts: View and manage alerting policies.
- downloadDownload: Download your logs in CSV or JSON format.For more information, seeDownload logs.
Download logs
Note: This feature doesn't support the bulk download of log entries. You candownload up to 10,000 log entries, provided the time toquery the logs and perform the download can complete within the timeout for thecommand.You cancopy logs in bulk to aCloud Storage bucket. To get the permissions that you need to download logs, ask your administrator to grant you theLogs View Accessor (roles/logging.viewAccessor) IAM role on your project. For more information about granting roles, seeManage access to projects, folders, and organizations.
logging.logEntries.download permission. You can alsogrant a role that contains thelogging.logEntries.list permission, which letsa principal view and download logs.You might also be able to get these permissions withcustom roles or otherpredefined roles.
To download your logs, do the following:
In theActions menu of theQuery results pane, clickDownload.
In theDownload logs dialog, select CSV or JSON format, and thenclickDownload.
Select what to do with the log data. You have the following options:
- Download the data to your computer.
- Download the data to Google Drive.
- View the data in a new tab.
When you save a CSV and select Google Drive, you can open the file inGoogle Sheets.
For troubleshooting information, seeDownload of logs fails.
Analyze results by using Log Analytics
You can aggregate, analyze, and chart your log data by using SQL queriesin theLog Analytics page when your project contains log buckets thatare upgraded to use Log Analytics. To go to the Log Analytics page fromthe Logs Explorer, in theQuery results toolbar, clickmanage_searchAnalyze results.
Themanage_searchAnalyze results button is visible only when thelog bucket that contains the log view you are querying has been upgraded to useLog Analytics. For example, if the toolbar displays![]() N log view, then themanage_searchAnalyze results button is shown when the log bucket for at least one of theselected log views is upgraded to use Log Analytics. For more information,seeUpgrade a log bucket to use Log Analytics.
N log view, then themanage_searchAnalyze results button is shown when the log bucket for at least one of theselected log views is upgraded to use Log Analytics. For more information,seeUpgrade a log bucket to use Log Analytics.
The following occurs when you clickmanage_searchAnalyzeresults:
The time range in the Logs Explorer might be automatically adjusted sothat there is meaningful log data in theLog Analytics page.
TheLog Analytics page opens in a new tab and automatically translatesthe current Logging query language query into a SQL query.
The resource selected by the Google Cloud project picker and a toolbarsetting determine how the
FROMclausein the SQL query is constructed. The selected resource can be a project,folder, or organization:If the toolbar displays
Project logs or_Default,then the resource's_Requiredand_Defaultbuckets are queried.If the toolbar displays
N log view, thenlog views on log buckets in the current project are queried.Log views on log buckets stored by different resources are ignored.If the toolbar displays
myscope, where "myscope"is the name of a custom log scope, then the previousrules are applied to the resources listed in the selectedlog scope.For example, if the log scope contains log views, then only thoselog views on log buckets stored by the resource are queried.
In the Log Analytics page, you can view your results in tabular form,or as a chart. In theChart tab, you can select the data that is charted,customize the chart configuration, or save a chart to a custom dashboard. Forinformation about creating charts from your query results and saving charts toa custom dashboard, seeChart query results with Log Analytics.
For information about using SQL to write queries, seeQuery and view logs in Log Analytics.
Summarize a log entry by using Gemini assistance
When investigating an issue, you can use Gemini to generatea summary of the log entry. To generate a summary of a log entry, do thefollowing:
Select the log entry you want to summarize, and clickchevron_rightExpand.
In the toolbar for the log entry, clickExplain this log entry.
Cloud Logging sends the text of the log entry toGemini Cloud Assist with a prompt to summarize thecontents of the log entry.Gemini Cloud Assist responds with a generated summary in theGemini pane. The summary is based only on thetext of the log entry without any additional context.
For more information about summarizing your logentries by using Gemini Cloud Assist, seeSummarize log entries with Gemini assistance.
Troubleshoot an issue by using Gemini assistance
Note: Use of this Preview offering of Gemini Cloud Assist is subject tothe Google Cloud Agreement, including the Pre-GA Offering Terms of theGoogle Cloud Specific Service Terms, as supplemented bythe terms for theGemini for Google Cloud Trusted Tester Program.To get help with troubleshooting an issue, create aGemini Cloud Assist investigation. Investigations use log and metricdata to gather insights about your complex and distributed environments andthey can help you understand, diagnose, and resolve issues in your Google Cloudinfrastructure and applications.
To create an investigation, do the following:
- Select a log entry that has a severity level of at least
WARNING. - Go to the toolbar for the log entry and clickInvestigate.
You might create an investigation to determine probable causes of issues andapply Gemini Cloud Assist-recommended solutions to help you resolvethese issues. For more information about investigations, see the followingdocumentation:
- Troubleshoot issues with Gemini Cloud Assist investigations
- Create a Gemini Cloud Assist investigation
- Manage Gemini Cloud Assist investigations
View similar log entries
You can view log entries that are similar to a selected log entry, which letsyou focus on logs of interest.
To show similar log entries, do the following:
Select a log entry and clickchevron_rightExpand.
ClickSimilar entries, and selectShow similar entries.
The query updates with a query similar to the following and reloads thequery results:
--Show similar entriesprotoPayload.methodName="io.k8s.core.v1.configmaps.update"--End of show similar entries
To see a preview of the similar log entries, do the following:
Select a log entry and clickchevron_rightExpand.
Expand theSimilar entries menu, and then selectPreview similar entries.
A separate dialog opens with the following information:
- The pattern that was found
- The percentage of log entries that contain the pattern
- Example log entries that contain the pattern
In this dialog, you can hide or show log entries:
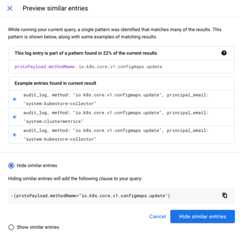
Hide similar log entries
You can hide similar log entries, which lets you remove logs from your queryresults.
There are two ways to hide similar log entries:
Hide large amounts of automatically grouped log entries. When yourun a query, the query results are analyzed forpatterns and log entries are then automatically grouped based on similar logfield content.
If a significant pattern is detected, a banner appears in theQuery results pane showing the percentage of results that can behidden.
Hide similar entries: This button adds a clause to the query and reloadsthe query results.
Preview: A separate window opens which describes the pattern found, andshows examples of the entries.
When you hide similar logs, no information is saved outside of theLogs Explorer session. Each query produces a new analysis, basedonly on the logs shown. Different queries analyze different portions of thelog entries depending on the types of logs returned.
Hide log entries similar to a specific log entry.
To hide log entries similar to a log entry, clickchevron_rightExpand, click theSimilar entries menu and then selectHide similar entries.
The query updates and theQuery results pane reloads. Log entriessimilar to the selected log entry aren't displayed.
View or hide log entries that match a field
You can view or hide log entries that match a field in a log entry, which letsyou focus on entries that contain the same field content.
To view or hide log entries that match a specific field in a log entry, do thefollowing:
Select a log entry and clickchevron_rightExpand.
Click a field's value within the log entry, such as
compute.googleapis.com,which is aserviceName.From the menu, selectShow matching entries orHide matching entries.
The query updates with a query that shows or hides similar entries, and theQuery results reload with new results.
Pin log entries
After you run a query, you can highlight a log entry by pinning it. The pinnedlog entry stays centered in theQuery results pane. If you run a new queryand the pinned log entry isn't included, then you are prompted to unpin the logentry.
To pin a log entry, do the following:
- Hold the pointer over the log entry that you want to pin.
- Clickpush_pinPin.
After you pin a log entry, its background is darkened, and apush_pinPin icon is shown. A pin iconalso appears on theTimeline pane based on the pinned log entry'stimestamp.
To unpin a log entry, click the pin icon again.
Show logs that match the resource of a pinned log entry
After you pin a log entry, you can run a new query that displays log entriesthat match the resource type or resource labels of the pinned log.
To pin a log entry and display log entries that match the same resource type orresource labels, do the following:
Clickarrow_drop_downDown arrownext to the pinned log to expand the pin menu.
Make a selection from the pin menu:
To rerun the query with the same
resource.typeas thepinned log, selectSame resource.type.For example, suppose you pin a log entry with a
resource.typeofk8s_node. If you selectSame resource.type, then the query isrerun to display all log entries withresource.type="k8s_node".To rerun the query with the same
resource.labelsas thepinned log, selectSame resource.labels.
- To rerun the query with the same
traceas the pinnedlog, selectSame trace.
- To clear the query and show all log entries, selectShow all.
View a pinned log entry in theTimeline
You can use theTimeline to highlight, scroll to, and further examinea pinned log entry.
Using theTimeline, clickpush_pinPin,and then choose from the following menu options:
- Scroll to log entry: Bring the log entry into the currentQuery results pane and view the pinned log entry in thecontext of nearby logs.
- Zoom to log entry: Narrow the time range that theTimeline pane displays and refine your query to isolate thelogs near the pinned log.
- Unpin: Unpin a log entry.
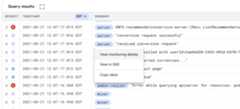
View trace data
When a log entry contains both thetrace and the latency-related field, boththe latency and trace icon appear.
When a log entry contains only thetrace field, then only the trace icon appears.
![]()
To view the trace data related to the log entry, click the trace icon. You havethe following options:
- View trace details: Shows the parent span and child traces along with details about the trace. To view more details about the trace, navigate to Cloud Trace by clickingView in Trace. For more information about the content in the details panel, seeFind and explore traces.
traceSampled is true.Show all logs for this trace: Refines and runs the query by adding the
tracefield set to the identifier of the trace associated with the log entry.Show only traced requests: Refines and runs the query by adding the
traceSampledfield set toTrue. For more information on sampling, seeSampling rate.
View Monitoring data
For certain logs, such as GKE and Compute Engine logs,you can select the resource type from the log's summary line to display amenu with the following options:
- View monitoring details: opens a details panel for aGKE resource. For information on the details panel, seeView resourcedetails.
- View in Monitoring: opens to aMonitoring page for the resource.
- View in GKE orView in Compute Engine: opens theDetails pagefor the resource within theGKE or Compute Engine user interface.
Copy a link to a log entry
To share a link to a log, expand a log entry, and then selectcontent_copyCopy. You can choose to copy a log in JSON, or alink to the log. The link is copied to your clipboard. You can send the link tousers who have access to the Google Cloud project. When a user pastes thelink into a browser or selects it, Logging pins the log entry intheirQuery results pane.
Example queries
For suggested queries, arranged by Google Cloud product and use case, seeSample queries using the Logs Explorer.For example, you can runKubernetes-related queries to findGoogle Kubernetes Engine logs.
View Compute Engine logs
For certain Compute Engine resource types, such asgce_instance andgce_network, you see the resource name with the resource ID as subtext inseveral places in the Logs Explorer. For example, for thegce_instanceresource type, you see the VM name alongside the VM ID. The resource names helpyou identify the correct resource ID, on which you can build queries.
You might see Compute Engine resource names in the following places:
- Query pane filter menus: Compute Engineresource types show resource names, with their corresponding resource IDs assubtext.
- Fields: Compute Engine resource typesshow the resource name, rather than the resource ID, in the field dimensions.
- Query results: For Compute Engine VM instance logs, the
resource.labelsfield shows metadata with the corresponding resource name. - Summary fields: For Compute Engine VM instancelogs, the chip shows the resource name instead of the resource ID.
Troubleshoot
This section provides instructions for troubleshooting common issues whenusing the Logs Explorer.
If you're experiencing issues when trying to view logs in sink destinations,seeTroubleshoot routing and sinks.
Download of logs fails
You are using the Logs Explorer and clickdownloadDownload.The command starts but then fails to complete or reports an error.
To resolve this issue, reduce the time it takes for the command to executeby trying the following:
- In theDownload logs dialog, reduce the value ofMaximum log entries.
- Reduce the time period over which logs are queried.
- In the query results toolbar, clickHide similar entries before youbegin the download.
- Modify your query to useindexed fields.
Can't find console logs for a VM instance
Logs written to the console of a Compute Engine instance might not be available in the Logs Explorer.To view these logs, do the following:
In the Google Cloud console, go to theVM instances page:
If you use the search bar to find this page, then select the result whose subheading isCompute Engine.
Select the instance, and then selectSerial port 1 (console) in theLogs section of the page.
You can configure your instances such that their serial port output issent to Cloud Logging. For more information, seeEnabling and disabling serial port output logging.
Get Google Cloud project or organization ID
To get a Google Cloud project or organization ID from anywhere in theGoogle Cloud console, expand the list of Google Cloud projects from theGoogle Cloud project and organization selector and find theGoogle Cloud project ID in theID column.
Can't see log entries
If you don't see any log entries, check the following:
Verify that the correct Google Cloud project is selected.
Verify that your Google Cloud project is using resources that generatelogs and that thereis activity on those resources. Even if the Google Cloud project isnew, it should have audit logs recording the fact that it was created.For information about how to verify thatyou're using a resource that generates logs, seeMapping services to resource types.
Ensure that the time range isn't too narrow.
View yourcurrent exclusion queriesto ensure that the logs you're looking for aren't accidentally excluded.
Ensure that you have permission to view the log entries in the projects andlog views referenced by setting of theRefine scope menu.For information about how to adjust the scope of your search, seeRefine scope.
My query is correct but I still don't see log entries
You can't see log entries that are older than the Loggingretention period. SeeLog retention periods for thelogs retention period in effect.
During periods of heavy load, there could be delays in sending logs toLogging or in receiving and displaying the logs.
The Logs Explorer doesn't show log entries that have timestamps in thefuture until the current time has "caught up" with them. This is an unusualsituation, probably caused by a time skew in the application sending thelogs.
The query scope was set too large and couldn't complete within a reasonableamount of time. You might see this as "deadline expired beforeoperation could complete". Try making your query more specific or reducingthe time range.
Query returns an error
If you issue a query over a resource without specifying a bucket, thenCloud Logging uses the history of the sinks in the Google Cloud project todetermine where entries might have been written for that resource. IfCloud Logging identifies more than 200 buckets where entriesmight have been written, then the query fails with the messageError: Invalid query.
To resolve this issue, refine the scope of your query to a subset of thestorage. For more information, seeRefine scope.
Query results time range doesn't match query
The logs data you see in theQuery results andFields pane adjustsaccording to the time range captured by the histogram timeline. You adjust thehistogram timeline using the histogram's time controls or thetime-range selector.Adjusting these time controls doesn't alterthe query expression in theQuery pane.
When you have a query with a timestamp, the time-range selector is disabled.The query uses the timestamp expression as its time-range restriction.If a query doesn't use a timestamp expression, then the query uses thetime-range selector as its time-range restriction.
Get support
For information on getting support, see theGoogle Cloud Observability support page.
Except as otherwise noted, the content of this page is licensed under theCreative Commons Attribution 4.0 License, and code samples are licensed under theApache 2.0 License. For details, see theGoogle Developers Site Policies. Java is a registered trademark of Oracle and/or its affiliates.
Last updated 2025-12-15 UTC.