

Troubleshoot log-based metrics
This page provides troubleshooting information for common scenarios when usinglog-based metrics in Cloud Logging.
Cannot view or create metrics
Note: If your data is managed through anAssured Workloads environment,then this feature might be impacted or restricted. For information, seeRestrictions and limitations in Assured Workloads.Log-based metrics apply only to a single Google Cloud project or to aLogging bucket within a Google Cloud project. You can'tcreate log-based metrics for other Google Cloudresources such as billing accounts or organizations. Log-based metrics arecomputed for logs only in the Google Cloud project or bucket in whichthey're received.
To create metrics, you need the correct Identity and Access Management permissions. For details,seeAccess control with IAM: Log-based metrics.
Metric is missing logs data
There are several possible reasons for missing data in log-based metrics:
New log entries might not match your metric's filter. A log-basedmetric gets data from matching log entries that are received after themetric is created. Logging doesn't backfill the metric fromprevious log entries.
New log entries might not contain the correct field, or the data might notbe in the correct format for extraction by your distribution metric. Checkthat your field names and regular expressions are correct.
Your metric counts might be delayed. Even though countable logentries appear in the Logs Explorer, it may take up to 10 minutes toupdate the log-based metrics in Cloud Monitoring.
The log entries that are displayed might becounted late or might not be counted at all, because they are time-stampedtoo far in the past or future. If a log entry is received byCloud Logging more than 24 hours in the past or10 minutes in the future, then the log entry won't becounted in the log-based metric.
The number of late-arriving entries is recordedin the log-based metric
logging.googleapis.com/logs_based_metrics_error_count.Example: A log entry matching a log-based metric arrives late.It has a
timestampof 2:30 PM on February 20, 2020 and areceivedTimestampof 2:45 PM on February 21, 2020. Thisentry won't be counted in the log-based metric.The log-based metric was created after the arrival of log entries that themetric might count. Log-based metrics evaluate log entries as they'restored in log buckets; these metrics don't evaluate logentries stored in Logging.
The logs-based metric has gaps in the data. Some data gaps are expected,because the systems that process the log-based metric data don't guaranteethe persistence of every metric data point.When gaps occur, they are typically rare and of short duration. However,if you have an alerting policy that monitors a log-based metric, then gapsin the data might cause a false notification. The settings you use in youralerting policy can reduce this possibility.
Example: A "heartbeat" log entry is written every five minutes, and alog-based metric counts the number of "heartbeat" log entries. An alertingpolicy sums up the counts in a five-minute interval and notifies you whenthe total is less than one. When the time series is missing a data point,the alerting policy injects a synthetic value, which is a duplicate of themost recent sample and is most likely to be zero, and then evaluatesthe condition. Therefore, even a single missing data point could resultin the summed value being zero, which causes this alerting policy to senda notification.
To reduce the risk of a false notification, configure the policy to countmultiple "heartbeat" log entries, not just one.
Resource type is "undefined" in Cloud Monitoring
Some Cloud Logging monitored-resource types don't map directly toCloud Monitoring monitored-resource types. For example, when you firstcreate either an alerting policy or chart from a log-based metric, you mightsee that the resource type is "undefined".
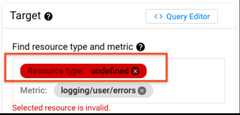
The monitored-resource type maps either toglobal or a differentmonitored-resource type in Cloud Monitoring. See theMappings for Logging-only resourcesto determine which monitored-resource type you need to choose.
resource.type="audited_resource" expression in thefilter. Instead, uselogName:"cloudaudit.googleapis.com".Labels in a notification aren't resolved
You create a log-based metric, and then you create an alerting policy tomonitor that log-based metric.In the documentation field of your alerting policy, you refer to theextracted labels by using a variable of the form${log.extracted_label.KEY}, whereKEY is the name you gavethe extracted label. The label isn't resolved in the notification.
To resolve this problem, do one of the following:
Remove the extracted label content from the documentation. Alerting policiesthat monitor log-based metrics can't extract data from log entries.
Create a log-based alert. These alerting policies can extract data fromthe log entry that causes the alerting policy to trigger.
Incidents aren't created or are false-positive
You could get false-positive incidents or situations whereMonitoring doesn't create incidents fromlog-based metrics because the alignment period for the alerting policyis too short. You might encounter false positives in the following scenarios:
- When an alerting policy usesless than logic.
- When an alerting policy is based on a percentile condition for a distributionmetric.
- When there is agap in the metric data.
False-positive incidents can occur because log entries can be sent toLogging late. For example, the log fieldstimestamp andreceiveTimestamp can have a delta of minutes in some cases. Also, whenLogging stored logs in log buckets, there is an inherent delaybetween when the log entries are generated and when Loggingreceives them. This means that Logging might not have the totalcount for a particular log entry until some later point in time after the logentries were generated. This is why an alerting policy usingless than logicor based on a percentile condition for a distribution metric can produce afalse-positive alert: not all the log entries have been accounted for yet.
However, log-based metrics are eventually consistent because a log entry thatmatches a log-based metric can be sent to Logging with atimestamp that is significantly older or newer than the log'sreceiveTimestamp.
This means that the log-based metric can receive log entries with oldertimestamps after existing log entries with the same timestamp have already beenreceived by Logging. Thus, the metric value must be updated.
For notifications to remain accurate even for on-time data, we recommend thatyou set the alignment period for the condition to be at least10 minutes. In particular, this value should be large enoughto make sure that multiple log entries that match your filter are counted. Forexample, if a log-based metric counts "heartbeat" log entries, which areexpected everyN minutes, then set the alignment period to2N minutes or10 minutes, whichever is larger:
If you use the Google Cloud console, then use theRolling windowmenu to set the alignment period.
If you use the API, then use the
aggregations.alignmentPeriodfield of thecondition to set the alignment period.
Metric has too many time series
The number of time series in a metric depends on the number of differentcombinations of label values. The number of time series is called thecardinality of the metric, and it must not exceed30,000.
Because you can generate a time series for every combination of label values, ifyou have one or more labels with high number of values, it isn't difficultto exceed 30,000 time series. You want to avoidhigh-cardinality metrics.
As the cardinality of a metric increases, the metric can get throttled and somedata points might not be written to the metric. Charts that display the metriccan be slow to load due to the large number of time series that the chart hasto process. You might also incur costs for API calls to query time series data;review the Cloud Monitoring sections of theGoogle Cloud Observability pricing page.
To avoid creating high cardinality metrics:
Check that your label fields and extractor regular expressions match valuesthat have a limited cardinality.
For example, don't store sizes, counts, or durations in labels. Also, don'tstore fields like URLs, IP addresses, or unique IDs, as these can allresult in a large number of time series.
Avoid extracting text messages that can change, without bounds, aslabel values.
Avoid extracting numerical values with unbounded cardinality.
Only extract values from labels of known cardinality; for example, statuscodes with a set of known values.
These system log-based metrics can help you measure the effect that adding orremoving labels has on the cardinality of your metric:
logging.googleapis.com/metric_throttledlogging.googleapis.com/time_series_countlogging.googleapis.com/metric_label_throttledlogging.googleapis.com/metric_label_cardinality
When you inspect these metrics, you can further filter your results bymetric name. For details, seeSelecting metrics: filtering.
Metric name is invalid
When you create a counter or distribution metric, choose a metricname that is unique among the log-based metrics in your Google Cloud project.
Metric-name strings must not exceed 100 characters and can includeonly the following characters:
A-Za-z0-9The special characters
_-.,+!*',()%\/.The forward slash character
/denotes a hierarchy of pieces within themetric name and cannot be the first character of the name.
Metric values aren't correct
You notice that the values reported for a log-based metric are sometimesdifferent from the number of log entries reported by the Logs Explorer.
To minimize the discrepancy, do the following:
Make sure applications aren't sending duplicate log entries. Log entries areconsideredduplicates when they have the same
timestampandinsertId.The Logs Explorer automatically suppresses duplicate log entries. However,log-based metrics count each log entry that matches the filter for the metric.Make sure that a log entry is sent to Cloud Logging when the timestamp isless than 24 hours in the pastor less than 10 minutes in the future. Log entries whosetimestamps aren't within these bounds aren't counted by log-based metrics.
You can't eliminate the possibility of duplicate logs. If an internal erroroccurs during the handling of a log entry, a retry process is invoked byCloud Logging. The retry process might cause a duplicate log entry.When duplicates log entries exist, the value of a log-based metric might betoo large because these metrics count each log entry that matches the filterfor the metric.
Label values are truncated
Values for user-definedlabels must not exceed1,024 bytes.
Cannot delete a custom log metric
You attempt to delete a custom log-based metric by using the Google Cloud console.The delete request fails and the deletion dialog displaysthe error messageThere is an unknown error while executing this operation.
To resolve this problem, try the following:
Refresh theLog-based metrics page in the Google Cloud console. The errormessage might be shown due to an internal timing issue.
Identify and delete any alerting policies that monitor the log-based metric.After you verify that the log-based metric isn't monitored by an alertingpolicy, delete the log-based metric. Log-based metrics that are monitoredby an alerting policy can't be deleted.
Except as otherwise noted, the content of this page is licensed under theCreative Commons Attribution 4.0 License, and code samples are licensed under theApache 2.0 License. For details, see theGoogle Developers Site Policies. Java is a registered trademark of Oracle and/or its affiliates.
Last updated 2025-12-15 UTC.