

Configure log-based alerting policies
You can configure an alerting policy to notify you whenever a specific messageappears in your included logs. For example, if you want to know when anaudit log records a particular data-access message, you can getnotified when the message appears. These types of alerting policies are calledlog-based alerting policies.This document describes how to do the following,by using the Google Cloud console and the Cloud Monitoring API:
- Create and test a log-based alerting policy.
- Edit a log-based alerting policy.
- Delete a log-based alerting policy.
Before you begin
Verify that billing is enabled for your Google Cloud project.
ReviewAlerting comparison to determine if log-basedalerting policies are a good fit for the data in your logs. For example:
Log-based alerting policies don't operate on excluded logs.
You can't use log-based alerting policies to derive counts from your logs.To derive counts, you need to uselog-based metrics instead.
To create and manage log-based alerting policies, your Identity and Access Management role mustinclude the permissions described inPermissions for log-based alerting policies.
Create a log-based alerting policy by using the Logs Explorer
You can create log-based alerting policy from theLogs Explorer pagein the Google Cloud console or by using the Monitoring API. This sectiondescribes how to create log-based alerting policies by using Logs Explorer.For Monitoring API information, seeCreate a log-based alerting policy by using the Monitoring API.
Log-based alerting policies don't honor the scope setting in theLogs Explorer page. Instead, when a project-level sink routes alog entry that originates in a project to a log bucket,log-based alerting policies defined in that project scan the log entry.To learn more, seeAvailable log entries.
The Logs Explorer interface guides you through the following steps:
- Provide details for the alerting policy, such as a name and a severity level.
- Choose the logs for which you want to receive a notification.
- Set the time between notifications.
- Set the time for automatic closure of incidents.
- Specify whom to notify.
For example, assume that you have an application that writes asysloglog entry withNOTICE severity when the application changes a network address.The log entries for network-address changes include a JSON payload that lookslike the following:
"jsonPayload": { "type": "Configuration change", "action": "Set network address", "result": "IP_ADDRESS",}You want to create a log-based alerting policy that notifies youwhen an invalid IPv4 address appears in thejsonPayload.result fieldof log entries insyslog withNOTICE severity.
To create this alerting policy, do the following:
In the Google Cloud console, go to theLogs Explorer page:
If you use the search bar to find this page, then select the result whose subheading isLogging.
Use theQuery pane to build a query that matches the message you wantto use in your log-based alerting policy.
For example, to find log entries with a severity level of
NOTICEin thesysloglog that have invalid IP addresses in the JSON payload, you canuse the following query:log_id("syslog")severity = "NOTICE"jsonPayload.result !~ "^((25[0-5]|2[0-4][0-9]|[01]?[0-9][0-9]?)(\.|$)){4}$"ClickRun query to validate the query.
In theQuery results toolbar, expand theActions menu and selectadd_alertCreate log alert.
In theAlert details pane, do the following:
Enter a name for your alerting policy in theAlert Policy Namefield. For example: "Network address: invalid IPv4 value".
Select an option from thePolicy severity level menu.Incidents and notifications display the severity level.
Optional: Add documentation for your alerting policy. You can includeinformation that might help the recipient of a notification diagnose theproblem. The following string summarizes the reason for the notification:
Log-based alerting policy in project ${project} detected an invalid IPv4 value.For information about how you can format and tailor the contentof this field, seeUsing Markdown and variables in documentationtemplates.
To advance to the next step, clickNext.
In theChoose logs to include in the alert pane, do the following:
Enter a query and or edit the existing query to filter available logs.Log entries that match the query cause the alerting policy to trigger.
To verify the query, clickPreview logs.
Optional: Extract log labels. You can create labels from log fields tobe displayed in any incidents and notifications created by the alert.
In the documentation field of your alerting policy, you refer to theextracted labels by using a variable of the form
${log.extracted_label.KEY}, whereKEYis the name you gavethe extracted label.
ClickNext.
Select the minimum time between notifications. This valuelets you control the number of notifications you get fromMonitoring if this condition is metmultiple times. For this example, select5 min from the options.
Optional: Select the incident autoclose duration. By default, theincident autoclose duration is set to 7 days.
ClickNext.
Select one or more notification channels for your alerting policy.For this example, select an email notification channel.
If you already have an email notification channel configured, then you canselect it from the list. If not, clickManage notification channels andadd an email channel. For information about creating notificationchannels, seeCreate and manage notification channels.
ClickSave.
Your log-based alerting policy is now ready to test.
Test the example log-based alerting policy
To test the alerting policy you created, you can manually write a log entrythat matches the query. To write the log entry, do the following:
Configure the following log entry by changing the
PROJECT_IDvariableto your project ID:{"entries":[{"logName":"projects/PROJECT_ID/logs/syslog","jsonPayload":{"type":"Configuration change","action":"Set network address","result":"999.027.405.1",},"severity":"NOTICE","resource":{"type":"generic_task","labels":{"project_id":"PROJECT_ID","location":"us-east1","namespace":"fake-task-2","job":"write-log-entry","task_id":"11",},},},],}
Go to the
logEntries.writereference page, or clickthe following button:Copy the log entry you configured previously.
In theTry this API pane, do the following:
Replace the content of theRequest body fieldin APIs Explorer with the log entry you copied in the previous step.
ClickExecute. If prompted, follow the authentication flow.
If the
logEntries.writecall is successful, then you get an HTTP200response code and an empty response body,{}. For more informationabout APIs Explorer, seeUsing the APIs Explorerin the Monitoring documentation; the APIs Explorerworks the same way with the Logging API.
The log entry matches the filter specified for the alerting policyin the following ways:
- The
logNamevalue specifies thesysloglog that is in yourGoogle Cloud project. - The
severityvalue for this log entry isNOTICE. - The
jsonPayload.resultvalue is not a valid IPv4 address.
After you write the log entry, the following sequence occurs:
- The new log entry appears in the Logs Explorer. The log entry meetsthe condition of the alerting policy.
- An incident is opened in Cloud Monitoring.
You receive a notification for the incident. If you configured an emailnotification channel, then the notification looks like thefollowing screenshot:
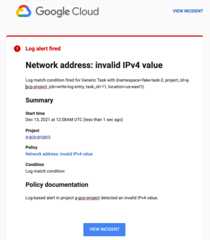
You can clickView incident in the email to see the incidentin Cloud Monitoring. For more information about incidents, seeManage incidents for log-based alerting policies.
Other scenarios: Alerting on audit logs
The example in the section titledCreating a log-based alerting policy isartificial; you don't typically create an alerting policy and then manuallywrite log entries that meet the alerting policy condition.Log entries are usually written by applications or other services.But the source of the log entriesdoesn't matter; for log-based alerting policies, what matters is the query thatyou use to select the log entries.
The following sections describe realistic scenarios for log-based alertingpolicies based on the content of audit logs. Each scenario illustrates how tocreate a query that selects the appropriate audit-log entries.Otherwise, the procedure for creating the log-based alerting policiesis the same as shown inCreating a log-based alert.
Alerting policies that monitor for human access of secrets
Suppose that your project stores secrets inSecret Manager, and some of these secretsare intended only for service accounts to use. Except in unusual circumstances,human users never access these secrets.
If you have enabledaudit logging forSecret Manager, then eachsuccessful attempt to access a secret creates an audit log entry. Each entryincludes the name of the secret and the caller's identity.
You can create a log-based alerting policy that notifies you when a human useraccesses a secret.
The following shows an excerpt of an audit log entry written bySecret Manager. The excerpt shows the fields that are useful forcreating the query for a log-based alert:
{"protoPayload":{"@type":"type.googleapis.com/google.cloud.audit.AuditLog","serviceName":"secretmanager.googleapis.com","methodName":"google.cloud.secretmanager.v1.SecretManagerService.AccessSecretVersion","authenticationInfo":{"principalEmail":"my-svc-account@PROJECT_ID.iam.gserviceaccount.com","serviceAccountDelegationInfo":[],"principalSubject":"serviceAccount:my-svc-account@PROJECT_ID.iam.gserviceaccount.com"},...},...}
The followingprotoPayload subfields are of particular interest:
@type: indicates that this log entry is an audit log entry.serviceName: records the service that wrote the audit log entry. Use thisfield to identify entries written by Secret Manager.methodName: identifies the method for which this audit log entry waswritten. Use this field to identify the action that caused this entry to becreated. In this example, it's theAccessSecretVersionmethod.authenticationInfo.principalEmail: records the account that invoked themethod in themethodNamefield. The expected value for this field is aservice account, which ends withgserviceaccount.com.
To find log entries for secret access by a human user, lookfor audit log entries written by Secret Manager. You want tofind the log entries in which theAccessSecretVersion method was invoked bya principal that doesn't end withgserviceaccount.com.The following query isolates these log entries:
protoPayload.@type = "type.googleapis.com/google.cloud.audit.AuditLog"protoPayload.serviceName = "secretmanager.googleapis.com"protoPayload.methodName =~ "AccessSecretVersion$"protoPayload.authenticationInfo.principalEmail !~ "gserviceaccount.com$"
To create a log-based alerting policy for human access of secrets, use thisquery in theChoose logs to include in the alert pane.
Alerting policies that monitor for decryption events
The analysis in the previous example can be adapted to other services.For example, if you useCloud Key Management Service to encrypt and decryptsensitive data, then you can useaudit logs generated byCloud KMS to detect whena human user decrypts a value.
To find log entries for decryption done by a human user, lookfor audit log entries written by Cloud KMS. You want to find thelog entries in which theDecrypt method was invoked bya principal that doesn't end withgserviceaccount.com, which indicatesa service account.The following query isolates these log entries:
protoPayload.@type = "type.googleapis.com/google.cloud.audit.AuditLog"protoPayload.serviceName = "cloudkms.googleapis.com"protoPayload.methodName = "Decrypt"protoPayload.authenticationInfo.principalEmail !~ "gserviceaccount.com$"
To create a log-based alerting policy for decryption done by a human user,use this query in theChoose logs to include in the alert pane.
Manage log-based alerting policies in Monitoring
You can view, edit, and delete log-based alerting policies by using theGoogle Cloud console for Monitoring or by using theMonitoring API. This document describes how to managealerting policies by using the Google Cloud console. For informationabout using the Monitoring API to manage alerting policies, seeManage alerting policies by API.
To see a list of all the alerting policies in your Google Cloud project,do one of the following:
To navigate from Logging:
In the Google Cloud console, go to theLogs Explorer page:
If you use the search bar to find this page, then select the result whose subheading isLogging.
In theQuery results toolbar, expand theActions menu and selecteditManage log alerts.
To navigate from Monitoring:
In the Google Cloud console, go to thenotifications Alerting page:
If you use the search bar to find this page, then select the result whose subheading isMonitoring.
To see all policies and to enable filtering, in thePolicies pane,clickSee all policies.
Both of these actions take you to the MonitoringPoliciespage, which lists all the alerting policies in your Google Cloud project.
To restrict the alerting policies that are listed, add filters.Each filter is composed of a name and a value. For example,you can set the value to be an exact match for a policy name,or a partial match. Matches are not case-sensitive.If you specify multiple filters, then the filters are implicitly joinedby a logicalAND unless you insert anOR filter.The following screenshot lists the alerting policies that are enabled and thatwere created after January 1, 2021:

From thePolicies page you can edit, delete, copy, enable, or disable analerting policy:
To edit or copy a policy, clickmore_vertMore options,and select an option.Editing and copying a policy is similar to the procedure described inCreate a log-based alerting policy. You can change and, insome cases, delete the values in the fields. When done, clickSave.
You can also edit a log-based alerting policy by clicking its namein the list of policies.
To delete a policy, clickMore optionsmore_vertand selectDelete. In the confirmation dialog, selectDelete.
To enable or disable the alerting policy, click the togglelocated under the headingEnabled.
Create a log-based alerting policy by using the Monitoring API
You can create log-based alerting policies by using theMonitoring API.You provide the same information to the Monitoring API that youprovide when you use the Logs Explorer in the Google Cloud console:
- Details for the alerting policy, such as a name and a severity level.
- The logs for which you want to receive a notification.
- The time between notifications.
- The time for automatic closure of incidents.
- Whom to notify.
timestamp label. Also, you can'textract any labels when you configure the alerting policy with theGoogle Cloud console. For more information about label extraction, seeChoose the logs for which you want to receive anotification.To create alerting policies by using the Monitoring API, youcreate anAlertPolicy object and submit it to thealertPolicies.create method.
Before you can use the Monitoring API, you must enable the APIand have authorization to use it. For more information, see the followingdocumentation:
Structure of alerting policies
The Monitoring API represents an alerting policy by using theAlertPolicy structure.TheAlertPolicy structure has several embedded structures, including adescription of the alerting policy condition. Log-based alertingpolicies differ from metric-based alerting policies in the following ways:
- You describe the condition by using the
LogMatchcondition type. Metric-based alerting policies use different condition types. - A log-based alerting policy can have only one condition.
- You specify the time between notifications and the automaticincident-closure period by including an
AlertStrategystructure. Metric-based alertingpolicies don't include a time between notifications.
This section describes how to create a log-based alerting policy. Thesepolicies differ from metric-based alerting policies in the type of conditionyou use. For log-based alerting policies,the condition type isLogMatch. When you usethe Monitoring API to manage alerting policies, there areno differences in how you list, edit, or delete metric and log-based policies.Manage alerting policies by API describes how to create,list, edit, and delete alerting policy by using the Monitoring API.
Notification rules
When you create a log-based alerting policy, Logging createsan internal object called a notification rule. Logginguses the notification rule to match incoming logentries to the filter of your alerting policy, and then to create a notificationwhen an entry matches the filter criteria. You don't interact directlywith the notification rule. However, to create a log-based alerting policy,you must have thelogging.notificationRules.create permission.
Design the alerting policy
The section titledCreate a log-based alerting policy by using the Logs Explorerdescribes one way to create a log-based alerting policy.That section shows how to createa log-based alerting policy that notifies you when asyslog log entry has aseveritylevel ofNOTICE and an invalid IPv4 address in thejsonPayload.resultfield.
To create the same log-based alerting policy by using theMonitoring API, youcreate anAlertPolicy object that looks like the following JSON structure:
{ "displayName": "Network address: invalid IPv4 value (API)", "documentation": { "content": "Log-based alerting policy in project ${project} detected an invalid IPv4 value.", "mimeType": "text/markdown" }, "conditions": [ { "displayName": "Log match condition: invalid IP addr (API)", "conditionMatchedLog": { "filter": "log_id(\"syslog\") severity = \"NOTICE\" jsonPayload.result !~ \"^((25[0-5]|2[0-4][0-9]|[01]?[0-9][0-9]?)(\\.|$)){4}$\"", }, } ], "combiner": "OR", "alertStrategy": { "notificationRateLimit": { "period": "300s" }, "autoClose": "604800s", }, "notificationChannels": [ "projects/PROJECT_ID/notificationChannels/CHANNEL_ID" ]}This JSON code specifies the same information that you specifywhen creating a log-based alerting policy by using Logs Explorer. The followingsections map the contents of thisAlertPolicy structure to the steps youfollow when using Logs Explorer to create a log-based alert. The valueof theconditionMatchedLog field is aLogMatch structure.
Provide a name and documentation
An alerting policy has a display name and associated documentation that isprovided with notifications to assist responders. In the Logs Explorer,these fields are calledAlert Name andDocumentation. You representthese values in anAlertPolicy structure as follows:
{"displayName": "Network address: invalid IPv4 value (API)", "documentation": {"content": "Log-based alerting policy in project ${project} detected an invalid IPv4 value.", "mimeType": "text/markdown" }, ...}In this example, the value fordisplayName includes "(API)"so that you can distinguish between the two example policieswhen viewing the list of policies in the Google Cloud console. TheMonitoringPolicies page lists policies by display name andindicates whether the policy is based on metrics or logs. For more information,seeManage log-based alerting policies in Monitoring.
Thedocumentation field includes, in thecontent subfield, the descriptionyou might supply when using the Logs Explorer. The second subfield,mimeType is required when you specify a value for thedocumentation field.The only valid value is"text/markdown".
Choose the logs for which you want to receive a notification
A log-based alerting policy has a single condition. In the Logs Explorer,you specify the condition when you supply a query in theDefine log entries toalert on field. You represent these values in anAlertPolicy structure asfollows:
{ ... "conditions": [ {"displayName": "Log match condition: invalid IP addr (API)", "conditionMatchedLog": {"filter": "log_id(\"syslog\" severity = \"NOTICE\" jsonPayload.result !~ \"^((25[0-5]|2[0-4][0-9]|[01]?[0-9][0-9]?)(\\.|$)){4}$\"", }, } ],"combiner": "OR", ...}Theconditions field takes a list ofConditionstructures, although a log-based alerting policy must have only onecondition. EachCondition has a display name and a description ofthe condition.
The value of the
displayNamefield is a brief description of the condition.When you use the Logs Explorer to create log-based alerting policies, thedisplay name is always "Log match condition". When you use theMonitoring API, you can provide a more precise display name.A value is required.The value of the
conditionMatchedLogfield is aLogMatchstructure, and the value of thefilterfield is the query you specify in the Logs Explorer. Because thisquery is provided as the value of a JSON field, the entire query appearsin quotes, and any quotes in the query itself must be escaped with the\(backslash) character.The
Note: Don't extract theLogMatchstructure also includes an optionallabelExtractorsfield. You canuse label extractors to compose custom labels from yourlog entries and then reference those labels in your notifications.timestamplabel. If you extract this label, thenthe alerting policy won't create incidents or send notifications.For example, to extract the value of the label
labels."compute.googleapis.com/resource_id"from your log entry intoa label calledvm_identifier, theprevious condition might look like this:"conditions": [ { "displayName": "Log match condition: invalid IP addr (API)", "conditionMatchedLog": { "filter": "log_id(\"syslog\" severity = \"NOTICE\" jsonPayload.result !~ \"^((25[0-5]|2[0-4][0-9]|[01]?[0-9][0-9]?)(\\.|$)){4}$\")","labelExtractors": {"vm_identifier": "EXTRACT(labels.\"compute.googleapis.com/resource_id\")" } }, }],Use the
EXTRACTfunction to match the entire value, or use theREGEXP_EXTRACTto match substrings based on regular expressions.These are the same function used for label extraction in log-basedmetrics; seeCreate a label for more information.You can use these extracted labels in the documentation of thealerting policy, so theyare reported in notifications. In the
documentationfield of youralerting policy, you refer to the extracted labels by using a variableof the form${log.extracted_label.KEY},whereKEYis the name you gave the extracted label.The following example shows how to refer to the key for theextracted label
vm_identifier, so that the value of the loglabellabels."compute.googleapis.com/resource_id"is included inthe notifications:"documentation": {"content": "Log-based alerting policy in project ${project} detected an invalid IPv4 value on VM with ID${log.extracted_label.vm_identifier}.", "mimeType": "text/markdown"},
The value for thecombiner field specifies how to combine the results ofmultiple conditions in metric-based alerting policies. You can only use onecondition in log-based alerting policies,and you must specify thecombiner field withthe value"OR". You can't create log-based alerting policieswith multiple conditions.
Set notification and auto-close values
A log-based alerting policy specifies the minimum time betweennotifications. In the Logs Explorer, you select a value from theTimebetween notifications menu.You represent this value in anAlertPolicy structure by specifying avalue, in seconds, for theperiod field of aNotificationRateLimit structure embedded in anAlertStrategy structure.
Similarly, the alerting policy includes the period for automaticallyclosing incidents. The default value is 7 days.In the Logs Explorer, you can select a different value from theIncident autoclose duration menu. The option corresponds to theautoclose field in theAlertStrategy API structure.When you use this field, specify the value in seconds. The minimum value is1,800 seconds, or30 minutes.
{ ... "alertStrategy": { "notificationRateLimit": {"period": "300s" },"autoClose": "604800s", }, ...}The value for theperiod field in this example,300s, is equivalent to5 minutes. Theautoclose value,604800s, is equivalent to 7 days.
Specify whom to notify
An alerting policy can include a list of notification channels.In the Logs Explorer, you select channels from a menu.You represent these values in anAlertPolicy structure by providinga list of one or more resource names for configuredNotificationChannel objects:
{ ..."notificationChannels": [ "projects/PROJECT_ID/notificationChannels/CHANNEL_ID" ]}When you create a notification channel, it is assigned a resource name.For information about retrieving the list of available notification channels,which includes their resource names, seeRetrieving channels in the Monitoringdocumentation. You can't get the channel IDs by using theGoogle Cloud console.
Note: You can manage notification channels by using theMonitoring API.Create and manage notification channels by API describeshow to create, list, edit, and delete notification channels by using theMonitoring API.Send your alerting policy to the Monitoring API
To create an alerting policy by using the Monitoring API, youcreate anAlertPolicy object and submit it to thealertPolicies.create method. You can invokethealertPolicies.create by using the Google Cloud CLI,calling the Monitoring API directly.
You can also create log-based alerting policiesby using the client libraries forC#, Go, Java, Python, and Ruby. You might also be able to use other clientlibraries; the library for your language must include theLogMatch condition type.
To create an alerting policy by using the gcloud CLI, do thefollowing:
Put the JSON representation of your alerting policy into a text file,for example, into a file called
alert-invalid-ip.json.Pass this JSON file to the gcloud CLI using the following command:
gcloud monitoring policies create --policy-from-file="alert-invalid-ip.json"
If successful, this command returns the resource name of the new policy, forexample:
Created alerting policy [projects/PROJECT_ID/alertPolicies/POLICY_ID].
To create an alerting policy by callingalertPolicies.create directly,you can use the APIs Explorer tool as follows:
Go to the
alertPolicies.createreference page.In theTry this API pane, do the following:
In the
namefield, enter the following value:projects/PROJECT_ID
Copy the JSON representation of your alerting policy and replace thecontents of theRequest body field in APIs Explorer with thecopied alerting policy.
ClickExecute.
If the
alertPolicies.createcall is successful, then you get an HTTP200response code and an empty response body,{}. For moreinformation about APIs Explorer, seeUsing the APIs Explorer in theMonitoring documentation.
For more information about creating alerting policies by using theMonitoring API, seeCreating policies.The examples in that document use condition types for metric-based alertingpolicies, but the principles are the same.
Test the alerting policy
To test your new alerting policy, you can use the same procedure describedinTest the example log-based alert.
Example: Create an alerting policy when a log entry contains a text string
This example uses the Google Cloud console to create an alerting policy, theLogs Explorer to view log entries, and the Google Cloud CLI towrite a log entry:
In the Google Cloud console, go to theLogs Explorer page:
If you use the search bar to find this page, then select the result whose subheading isLogging.
In theQuery pane, enter the following query after updating thevalue of thePROJECT_ID:
logName="projects/PROJECT_ID/logs/test-log"textPayload:"Oops"
The query searches the log with the name
test-logfor log entries thathave atextPayloadfield that contains the string "Oops".In theQuery results toolbar, expand theActions menu and selectadd_alertCreate log alert. Then, complete the dialog.
You must enter a name for the policy, like
Alert on Oops. The query thatyou entered in the previous step is automatically included in the alertingpolicy.To test the alerting policy, open the Cloud Shell and thenrun the following command:
gcloud logging write test-log --severity=ERROR --payload-type=text 'This log entry contains Oops'
The previous command writes an entry to the log named
test-log. Theentry has a severity level ofERRORand includes atextPayloadfield.In the Logs Explorer, clickRun query.
After the display is refreshed, you can view the details of the log entrythat you wrote in the previous step.
In the Google Cloud console, go to thenotifications Alerting page:
If you use the search bar to find this page, then select the result whose subheading isMonitoring.
TheIncidents pane displays the incident and detailsabout the alerting policy.
If you don't see an incident when you open theAlerting page,then wait a few minutes and refresh the page.
You won't see another incident or get another notification if youimmediately repeat the Google Cloud CLI command. The alerting policy settingsspecify the minimum time period between incidents. You can view and changethose settings by editing the policy.
Except as otherwise noted, the content of this page is licensed under theCreative Commons Attribution 4.0 License, and code samples are licensed under theApache 2.0 License. For details, see theGoogle Developers Site Policies. Java is a registered trademark of Oracle and/or its affiliates.
Last updated 2025-12-15 UTC.