

Observe your traffic using GKE Dataplane V2 observability
This page shows you how to observe your traffic using GKE Dataplane V2 observability.For more information on the benefits and requirements of GKE Dataplane V2 observability,seeAbout GKE Dataplane V2 observability.For information on configuration, seeSet up GKE Dataplane V2 observability.
How to use GKE Dataplane V2 observability
Start by enabling GKE Dataplane V2 metrics with Google Cloud Managed Service for Prometheus.To create custom dashboards and set alerts similar to any of the metrics thatyou've been monitoring, you can useGoogle Cloud Observability tools suchasCloud Monitoring Metrics Explorer.
You can also configure any third-party dashboard or tooling that uses Prometheus,including Grafana. With your GKE cluster enabled with GKE Dataplane V2observability, you can inspect traffic with GKE Dataplane V2 observability tools.
Visualize metrics and Service dependencies
You can visualize Kubernetes traffic metrics and Service Dependencies as follows:
View cluster and workload observability metrics
To view GKE Dataplane V2 metrics for your clusters, perform the following stepsin the Google Cloud console in the Metrics Explorer:
Go to theMonitoring Metrics Explorer page.
Select theMetric under theQuery as either thePrometheus Target prometheus/pod_flow_egress_flows_count orprometheus/pod_flow_ingress_flows_count/counter.
(Optional) Choose any selected filters based onLabels.
(Optional) Save the chart to a customDashboard.
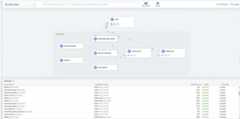
Visualize Service dependencies
Use the Hubble UI to be able to determine the dependencies of the Pod and Servicesdeployed on your cluster at a glance. Visualize the traffic flows including thosereaching out to external destinations. Filter by namespaces, Kubernetes labels,and more.
Verify traffic flows
The Hubble UI can also be used to view live flows happening on your cluster.Each live flow shows the source and destination services, destination port,Policy verdicts and timestamps.
Inspect traffic with GKE Dataplane V2 observability tools
You can capture and analyze network traffic using GKE Dataplane V2 observabilitytools, accessed using a private endpoint. The endpoint is exposed on an internalIP address, which you can access from within the Kubernetes cluster and theVPC within which the cluster resides.
To inspect network traffic metadata, use the following commands:
Use the built-in hubble-cli plugin to inspect network traffic
aliashubble="kubectl exec -it deployment/hubble-relay -c hubble-cli -n gke-managed-dpv2-observability -- hubble"hubbleobserveThis command inspects network traffic for the cluster.
Use the built-in hubble-cli plugin to inspect network traffic in follow mode
aliashubble="kubectl exec -it deployment/hubble-relay -c hubble-cli -n gke-managed-dpv2-observability -- hubble"hubbleobserve-fThis command inspects network traffic metadata in following mode for the cluster:
Use the built-in hubble-cli plugin to inspect network traffic in single namespace
aliashubble="kubectl exec -it deployment/hubble-relay -c hubble-cli -n gke-managed-dpv2-observability -- hubble"hubbleobserve-ndefaultThis command uses the built-in hubble-cli plugin to inspect network traffic forthe default namespace in the cluster.
To enableHubble Relay use the--enable-dataplane-v2-flow-observability flag.
Analyze traffic flows
Use the Hubble CLI to observe live traffic flow dumps with the ability to filterwith Kubernetes namespaces and more.

What's next
Except as otherwise noted, the content of this page is licensed under theCreative Commons Attribution 4.0 License, and code samples are licensed under theApache 2.0 License. For details, see theGoogle Developers Site Policies. Java is a registered trademark of Oracle and/or its affiliates.
Last updated 2025-12-15 UTC.